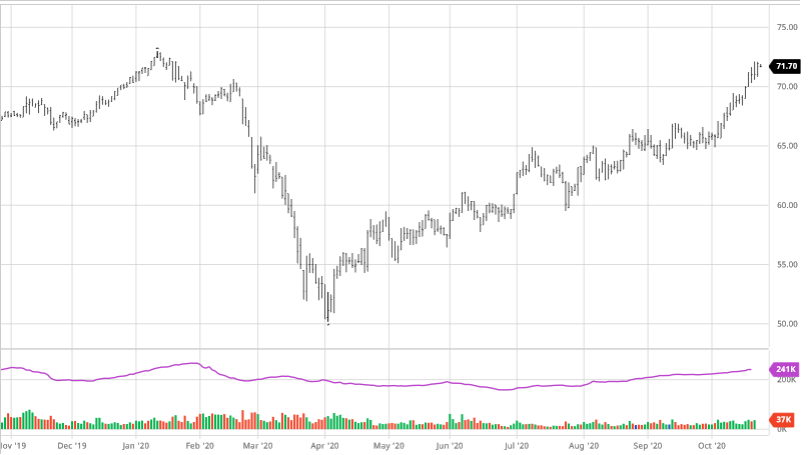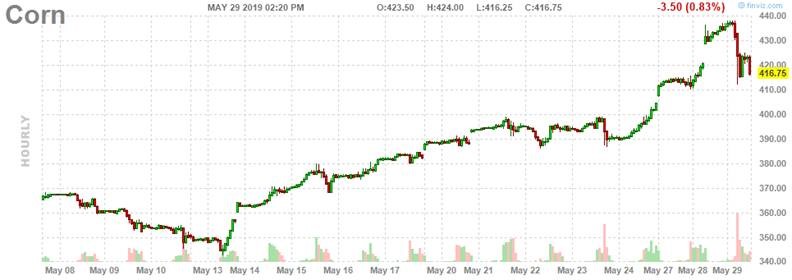

 Corn was up only 1 cent on the week amidst what was shaping up to be a strong week. Once the disappointing export report was released Thursday, coupled with favorable South American weather, prices shot back down. Weakness in the soybean market today also had a spillover effect into the corn market as they took it on the chin. Southern Brazil’s forecast turned wetter, while Argentina remains relatively dry. The dryness in Argentina, if it continues, could lead to additional yield loss as they are in an important time for their crop. The bounce back off the lows today is a good sign as there appears to be buyers under the market to support corn and keep the market in the range they have been trading in the last month.

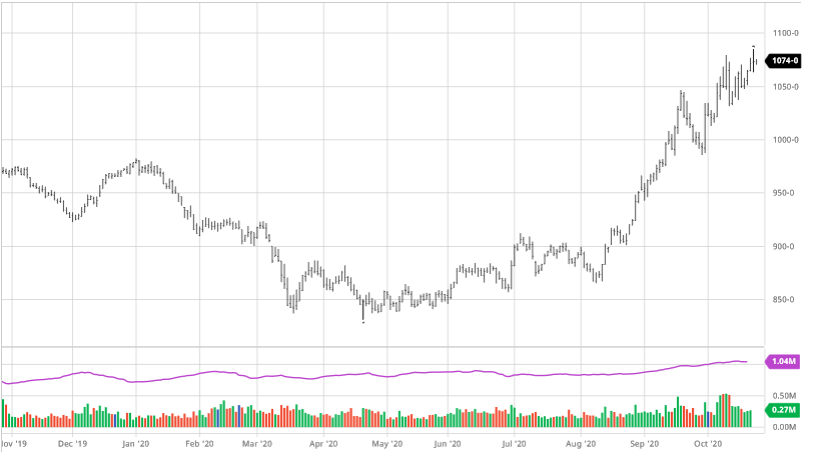
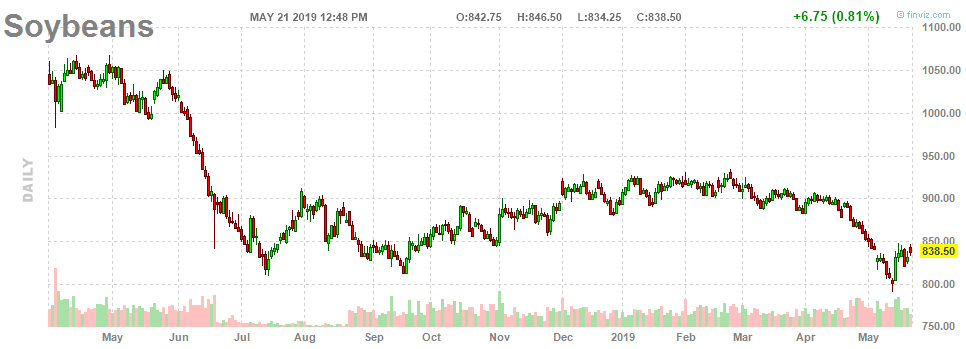
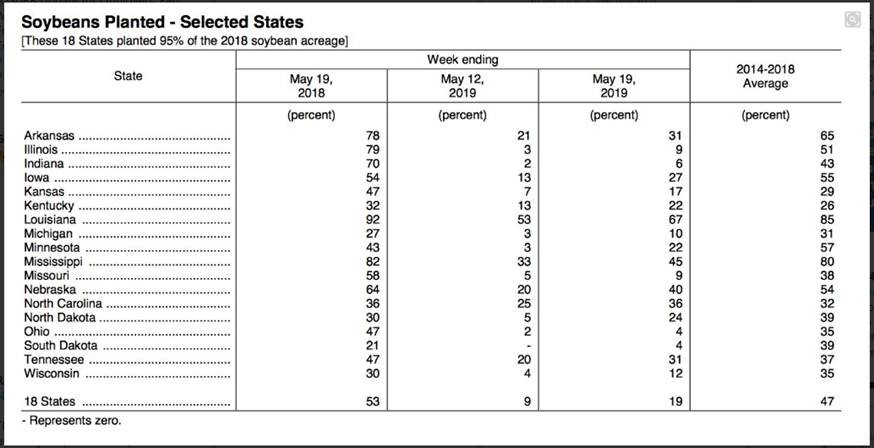
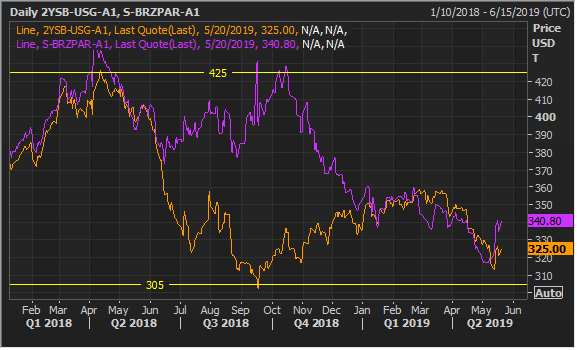
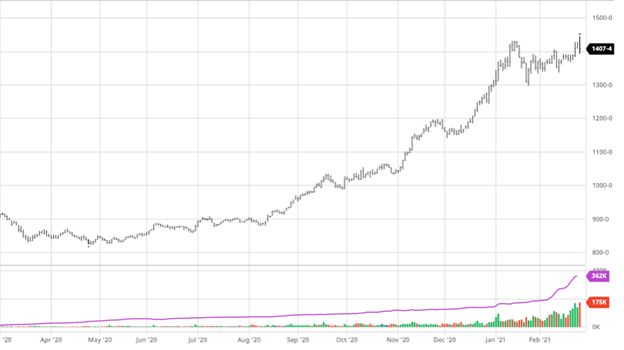
Soybeans gained on the week (despite having a tough day on Thursday) thanks to a strong first 3 days of the week. Northern Brazil is continuing to dry out and harvest is rolling again, but its still well behind last year and their yearly average. The struggle with harvest in Brazil has helped with this runup as demand has been pushed to the US. At the current record pace, the US is potentially set up to run out of beans by mid-summer. The cancellation of beans on this week’s export report was the main cause for Thursday’s pullback, but it is also important to note that Brazil’s beans are cheaper and the gap may be narrowing. It will be important for China to keep buying US beans to keep prices at current levels or better; if they begin to shift buying to Brazil we could see another pullback. Keep an eye on exports as we get more numbers out of Brazil and their weather struggles – both will have major impacts on US prices.
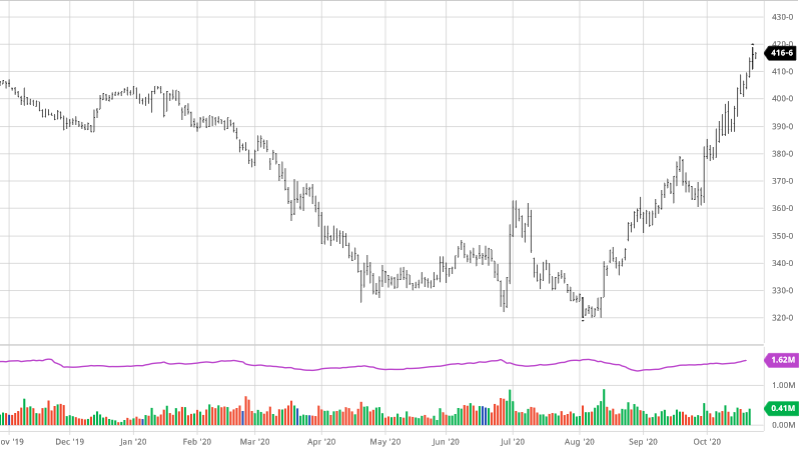
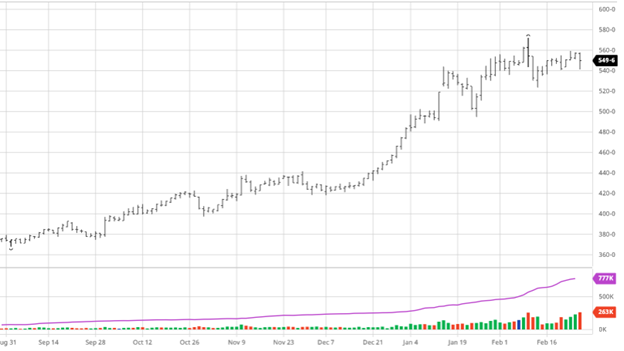
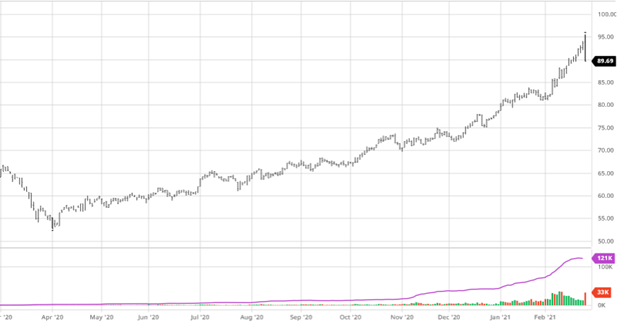
 Cotton had a strong week getting as high as 95 cents before a limit down day Thursday wiped out all of the weeks gains. Exports this week were also disappointing for cotton, despite China coming back from it’s weeklong Chinese Lunar New Year. One thing we usually see when there are dips like this are mill buyers who will take advantage of drawbacks and cheaper prices. They will not be the support under the market, but once the market bounces, they help provide the fuel to get it back higher. As other commodities have leveled off from their runs up the last few months this was the first shock to the cotton market. Looking ahead, while the world slowly continues to come out of Covid conditions, normalcy of consumer spending is expected to ramp up and likely drag all commodities – and especially cotton – higher as people resume buying apparel and other cotton based products.

Dow Jones
The Dow has had an up and down week but most of the volatility in the markets this week was focused in the NASDAQ and tech stocks. Rising interest rates have been the main factor driving volatility as it leaves many questions about inflation and other market factors that were not at the forefront of discussions 6 months ago.
Insurance
This month is important for revenue-based insurance averages so it will be important to keep an eye on the markets even if you do not plan on making any sales. As of the close on 2/25 the price for corn is $4.5776 and soybeans are $11.8463.
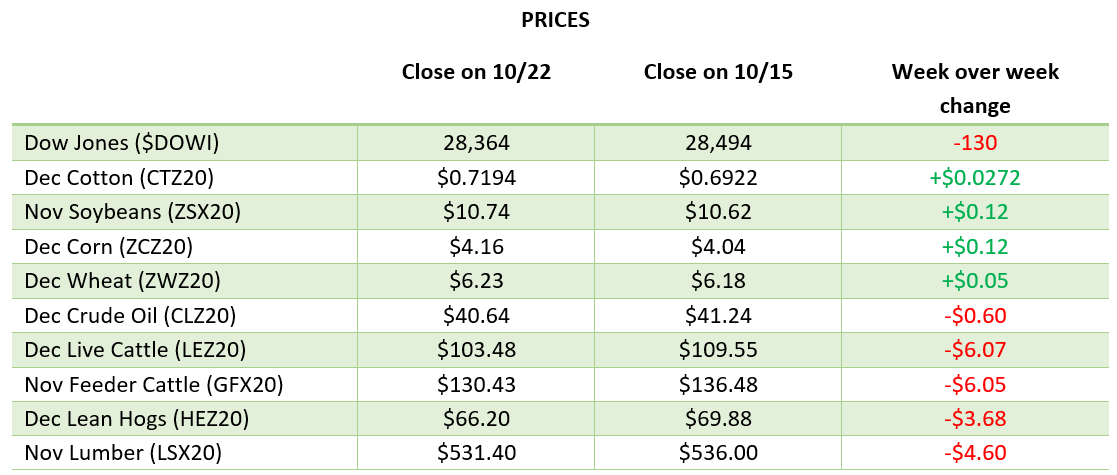
Prices
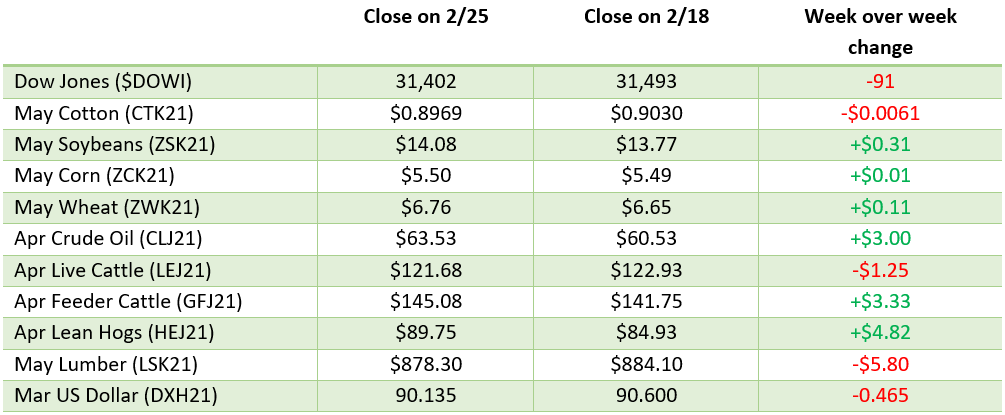
Via Barchart.com