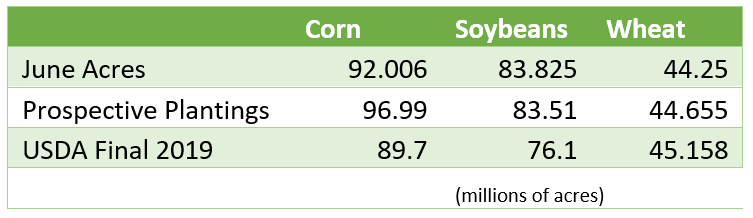


Corn finally got some positive news in the USDA report this week with planted acres coming in well below the March estimate and below the trade estimate. Planted acres came in 92.006 million which is about 5 million acres less than the estimate in March of 96.990 million. One thing of note from the USDA NASS Farm Labor survey that took place between May 30 and June 16, is that there was still 2.24 million acres of corn to be planted of the 92.006 million. This means that the acreage could still be lower if the entirety of that 2.24 million gets planted. Even with the bullish acres news there was still some bearish news in the report when it came to the quarterly grain stocks report. Something that is also important to keep in mind that just because 92 million acres are planted does not mean there will be that many harvested. Even with a solid trend line yield north of 178, these acreage numbers should help. As always, keep an eye on exports and weather as the fundamental market movers in the short term.
Quickly touching on the weather outlook, there looks to be heat and dryness for the next couple of weeks in many areas. This will put some stress on the crop and this kind of forecast along with the USDA numbers from this week are the 2 catalyst moving corn higher.
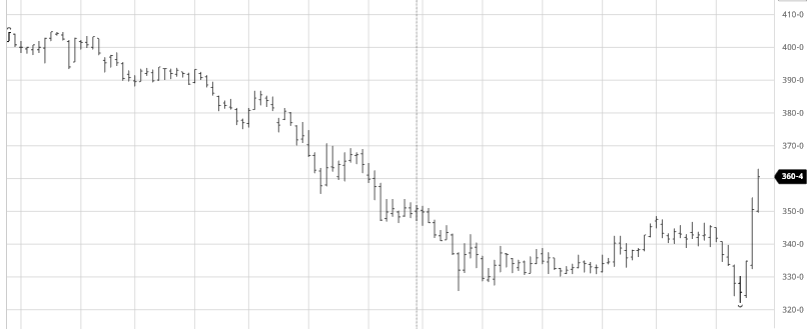
Dec ’20 Chart

Soybeans prices, like corn, saw a big bump from the NASS report, even though there wasn’t as much obvious bullish news from the acreage report. The acres did not change much from the March estimate of 83.510 million to 83.825 million acres. The trade estimate had it higher, trading at 84.716 million, which allowed for prices to jump up along with corn. Many people think that the acres are higher as a possible landing spot for those 5 million acres of corn that disappeared. Do not be surprised if we see more acres down the road. Soybeans in the long run still need as many exports to China as we can get going forward. The trend line yield of 50 bushels per acre is still in play with the start we have had but like mentioned above for corn the heat and dryness in the upcoming weeks could impact yield.
From speaking to farmers, it seems many farmers who planted in April and got washed out switched their acres from corn to soybeans. We are not sure how widespread this, is but don’t be surprised if soybean acres is higher when all is said and done.
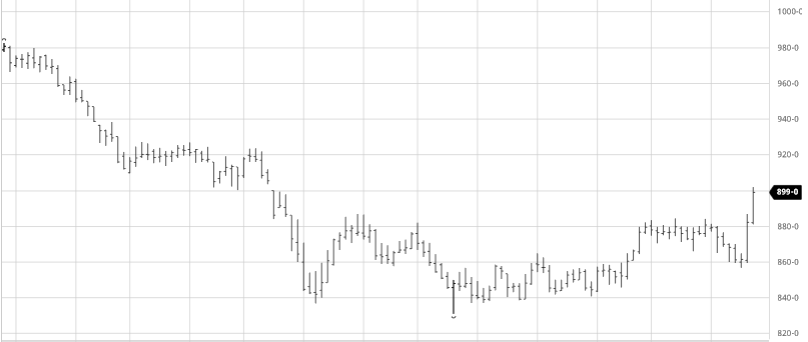
Nov ’20 Chart

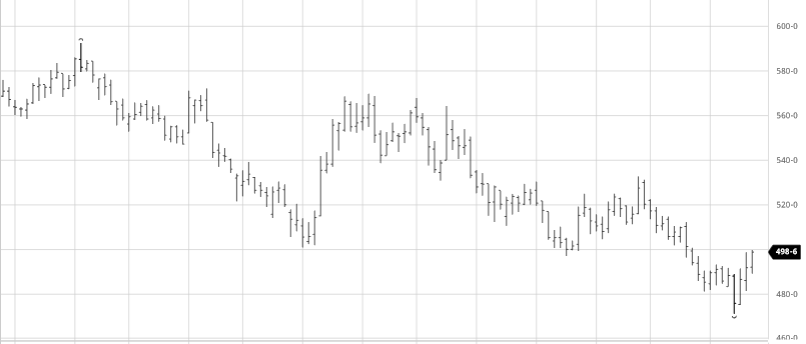
Wheat got a boost out of the report just like corn and soybeans. Wheat’s gains came mostly as a result of following corn and beans higher as the report was not as bullish for wheat. Wheat acres were down 400,000 from the March estimates. It was welcome for wheat prices as they have been on a losing streak the last month as we look towards July for some help. If corn and soybeans continue to find support and prices go up look for wheat to be a benefactor of that as well.
Sep ’20 Chart

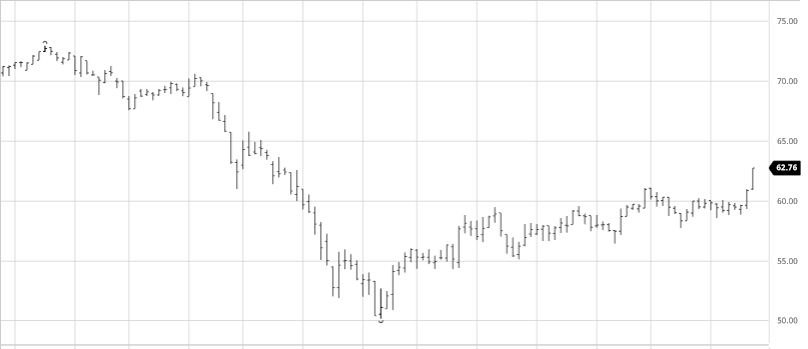
The report was bullish for cotton as well as we have seen a rally because of it. Planted acres were down over 1.5 million acres from 13.703 million to 12.185 million acres. This is also down 11 percent from 2019. Cotton prices got a boost when these numbers came out as many acres were not planted due to a wet spring or prices being too low. Knowing the acreage number now moving forward weather in the major cotton areas will be important to keep an eye on. A tropical storm or drought, depending where, could cause cotton to jump like it has from this report.
Dec ’20 Chart

Miscellaneous
Planted Acreage for principle crops dropped 7.2 million acres from the March report, 5 million of which came from corn. The big question is where did these acres go? We may see a lot go to prevent plant as only 3 million acres are estimated for PP but it is possible that a lot of acres were not planted because of depressed prices as a result of loses from the trade war the past couple years and the disruptions from COVID-19 pandemic all could be factors. Click here for the acreage report.