Weekly Lumber Recap
12/4/22
If you have been around long enough you have seen times when there is no market. It was always caused by some event. This time the focal point is on the free money causing an overbuilt/overpriced housing sector. The market now has to digest the run up. Commodities in general will have extended swings as traders are either 100% in or totally out. The issue today is that the buyside continues to add cheap product to the pile for the first quarter. This could be a Peter and Paul moment. We are going into a critical week for the market. There needs to be a shift in interest level going into the end of the year. We shall see.
I talked about the futures market starting with a 3 handle back in late July. It took over 4 months to get there. Except for a few corrections the futures market has traded sideways. Only when the cash market accelerated down did futures finally sell off. Futures were building the bottom end of the range. Today they are just following an unhinged cash market. My point being that futures is looking at the low $400 as a tradable level. That is not a buy recommendation, just a value area. I have been around too long to think the mills will find a bottom anytime soon. Firms today really believe that all this will end soon, and things will be back to normal. There is little planning going on to limit exposure. It will take time.
The technical picture could be friend or foe. On the friendly side the whole momentum complex has come together. Rarely has a market continued its trend without some type of correction. With the RSI at 29% there may be more downside but with the pattern and going into the holidays I expect a little pop. Now on the foe side the Bollinger bands are moving sideways but January futures closed under the lower band. Futures tend to bounce right back into the band area. If futures continue down, it will take time and distance for the bands to catch up. Doing the math today that level would be $307.80. There is the shock.
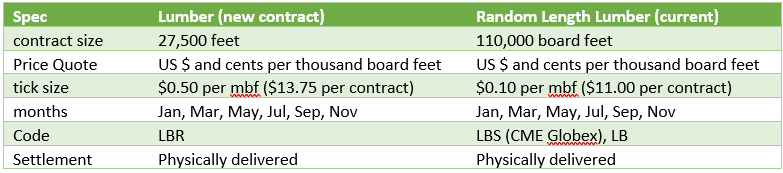
NEW CONTRACT:
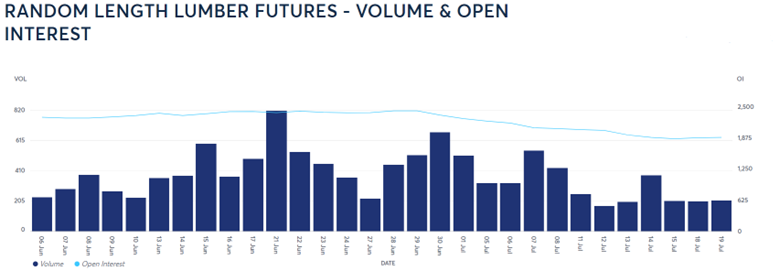
Lumber Futures Volume & Open Interest
CFTC Commitments of Traders Long Report
https://www.cftc.gov/dea/futures/other_lf.htm
Lumber & Wood Pulp Options
https://www.cmegroup.com/daily_bulletin/current/Section23_Lumber_Options.pdf
About the Leonard Report:
The Leonard Lumber Report is a column that focuses on the lumber futures market’s highs and lows and everything else in between. Our very own, Brian Leonard, risk analyst, will provide weekly commentary on the industry’s wood product sectors.
Brian Leonard
bleonard@rcmam.com
312-761-2636