Category: Risk Management

03 Aug 2026

LEONARD LUMBER REPORT: Fifty dollars in five days. Lumber futures gave it all back.

Fifty dollars in five days. Lumber futures gave it all back.

While there was weakness in the cash market, it was nowhere near that severe. There were many combinations of players involved, but at the end of the day it was the algo-driven push that unraveled the move. That forced the longs out and brought the industry in.

The Commitment of Traders report adds another layer of confusion, as it shows funds getting longer. The issue is that the data only runs through Tuesday, so it does not yet provide a complete picture of the market’s current makeup.

To keep it simple, this appears to be some type of computerized trade. The larger the bid in the deck, the faster the system reacts to selling it. That is not a typical lumber trader. 

One thing worth noting is that, just as with the previous rally, the computer-generated activity creates a great deal of air in its wake.

As I mentioned earlier in the week, whatever the reason, at these levels does the market present opportunity?


The mortgage rate creep can’t be discounted using the supply excuse. I was just bragging about it headed lower. With this back and forth, I would not expect the builders to deviate in the second haft from their original construction plans. 

It’s no surprise that the technical read turned negative. The tradable factor is that the market remains in the uptrend that began last November. That trendline currently comes in at 581.20, leaving plenty of room from today’s levels.

The negative is that the stochastics crossed lower on the weekly chart last week. Once that signal changes direction, it tends to remain in place for several weeks. The last crossover occurred in late May and was to the upside.

With the daily RSI at 26%, some back-and-forth trade would not be surprising. Longer term, the major support areas continue to be 618, 600, and 580.

The computer-driven selling pushed the market through 618 as if it were not even there. If the algo influence fades, attention will likely shift back to the 200-day moving average, which currently sits at 636.10. That level could quickly become an important reference point for both traders and the industry.


The bigger question remains whether the recent selloff has created opportunity or simply reset expectations after an extended rally. The answer will likely depend on whether the market can stabilize above key support levels and whether the cash market begins to confirm the futures action.

27 Jul 2026

LEONARD LUMBER REPORT: Futures rallied nearly $30 last week

Futures rallied nearly $30 last week and more than $60 over the last two weeks. That is a substantial move. The rally actually began back in November 2025 and is now up roughly $170 from those lows.

The data is not showing a major increase in demand. We have been seeing production slow over time, but is that enough to justify a $60 move in two weeks and a $170 advance overall? The funds may think so.

Open interest bottomed near 6,200 and now sits above 8,000 after only a few sessions. The Commitment of Traders report shows an increase in fund longs, but also a jump in industry participation on both sides of the market.

The pace of the cash market remains muted, yet prices continue to grind higher. Futures will need willing buyers at these levels to sustain the rally. If futures continue higher, the cash market is likely to follow.

From a macro perspective, this market is increasingly becoming a debate between balance and imbalance. We came into the year with what appeared to be a fairly balanced supply-and-demand picture, alongside an oversupplied housing market. Today, that housing oversupply is beginning to come down. Again, is that enough to justify the move? Probably not unless interest rates begin to decline.

Another question mark that emerged last week was the shift in economists’ views on true housing demand. The loss of immigration and an aging population suggest that less housing supply may be needed than previously believed. Will builders be forced to lower their outlooks on a year-over-year basis? That question could add another layer of volatility to the trade, and it may already be contributing to the current rally.

The futures run early in the week pushed the market into overbought territory. The Thursday-Friday trade corrected some of that condition, which is a healthy development.

What to watch now is the technical picture. The short-term moving averages are close to crossing above the 200-day moving average for the first time in years. That is a very positive indicator, but it is not necessarily a buy signal. It may simply be confirming the thesis that the typical trading range has shifted higher.

The key level this week is 660.00. That represents the 81% retracement of the 2025 trading range. A close above 660.00 could open the door to a push back toward 700.00.

A modest correction would be healthy. The last move to 700.00 was driven largely by noise. If the market makes another run at that level, the driving force this time appears more likely to be fund participation. Let’s give it a few days and see how it develops.


Daily Bulletin:

https://www.cmegroup.com/daily_bulletin/current/Section23_Lumber_Options.pdf

Southern Yellow Pine:

https://www.cmegroup.com/markets/agriculture/lumber-and-softs/southern-yellow-pine.volume.html

The Commitment of Traders:

https://www.cftc.gov/dea/futures/other_lf.htm


About the Leonard Report:

The Leonard Lumber Report is a column that focuses on the lumber futures market’s highs and lows and everything else in between. Our very own, Brian Leonard, risk analyst, will provide weekly commentary on the industry’s wood product sectors.


Brian Leonard

bleonard@rcmam.com

312-761-263

27 Jul 2026

AG MARKET UPDATE: JULY 10 – 24

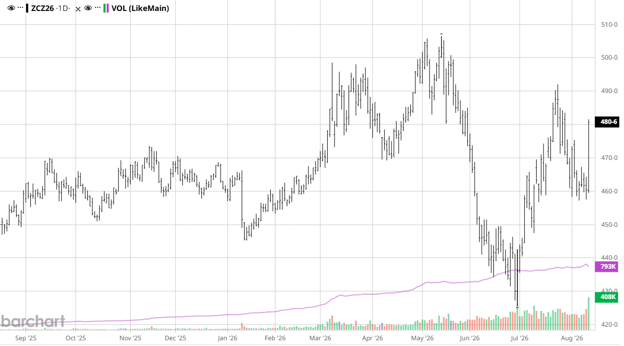
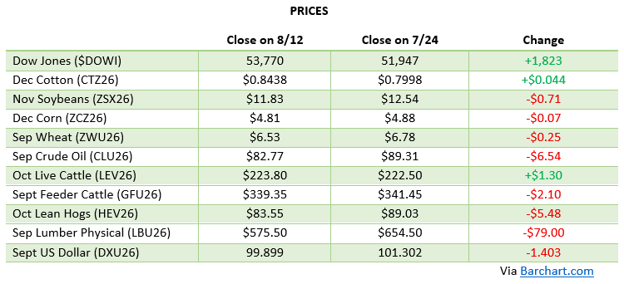
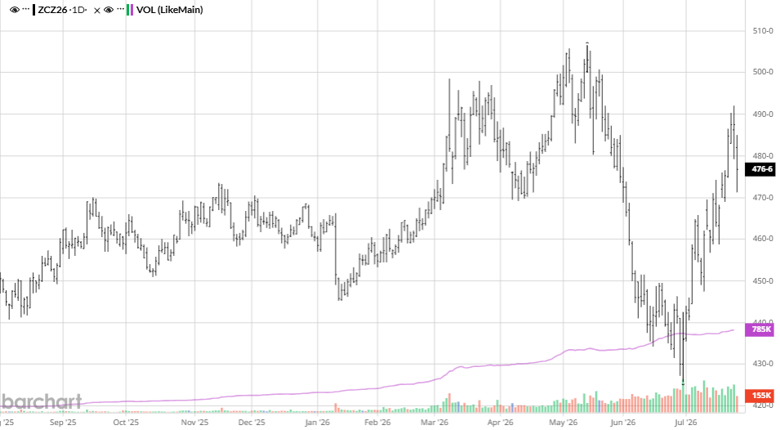
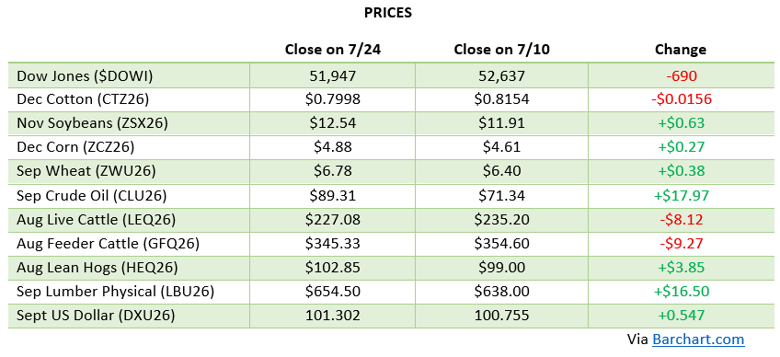
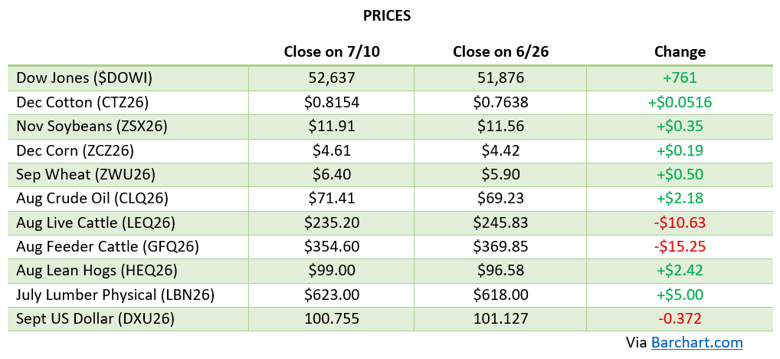
Corn caught a boost from the July 10th WASDE report, which cut 2026/27 ending stocks to 1.79 billion bushels, 200 million lower than June, on stronger-than-expected old-crop demand that trimmed 2025/26 carryout by 125 million bushels to 2.02 billion. Even with production pegged at a record 16.0 billion bushels, the tighter carryout was enough to spark buying, and December corn settled the WASDE session at $4.60. The rally extended over the following two weeks as a hot, dry pattern settled over the Corn Belt right through pollination, the most critical stretch for yield determination, with December corn touching $4.92 on July 24th, its highest intraday level since May 21st, before fading back into the $4.80s. Export demand has been the other pillar of support: 2025/26 corn sales commitments have already topped 3.41 billion bushels, up nearly 24% from a year ago and above USDA’s full-year forecast of 3.325 billion bushels, while 2026/27 bookings are running 12% ahead of last year’s pace. With the crop pushing through its most sensitive growth stage under some stress, and NASS heading into the field July 25th through August 5th for the first survey-based yield numbers of the season, weather will remain the dominant driver into the August 12th WASDE. Prices are lower to start the week of July 27th.

Via Barchart

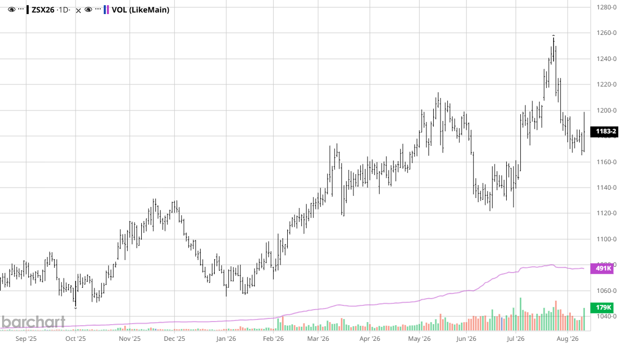
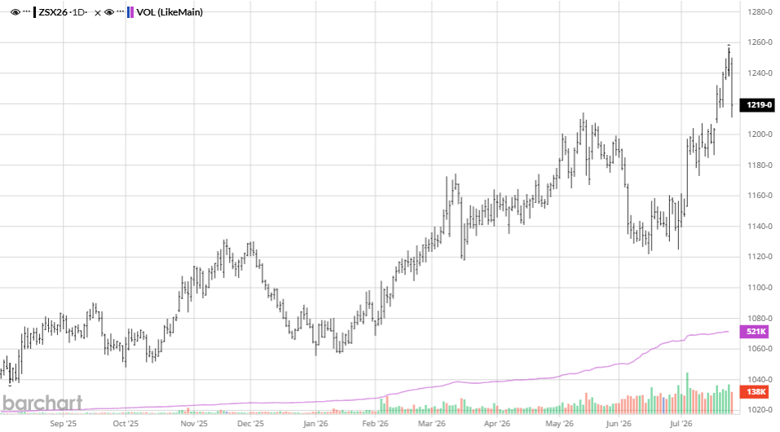
Soybeans got a mixed signal from the July WASDE: USDA raised 2026/27 production 40 million bushels to a record 4.475 billion on higher harvested acres, but a matching bump in exports left new-crop ending stocks unchanged at 310 million bushels, while old-crop 2025/26 carryout actually tightened another 10 million to 330 million bushels. Crush held steady at a record 2.75 billion bushels. New-crop November futures have been the standout performer of the period, climbing from the low-$12 area into the $12.40s-$12.50s by July 23rd-24th, territory not seen in a new-crop contract since December 2023, as the same hot, dry forecast pressuring corn is raising concerns about pod-setting and seed fill during this critical stretch. Chinese demand has quietly turned into a real tailwind rather than just a headline, China has been a steady buyer of new-crop beans in recent weeks, and traders are increasingly optimistic that the long-delayed Trump-Xi meeting, now being framed as a late-September event, could bring another leg of purchases. We are close to the point where it wouldn’t take much more than a one-bushel-per-acre yield hit to make U.S. supplies uncomfortably tight, so August weather is squarely in the driver’s seat.

Via Barchart

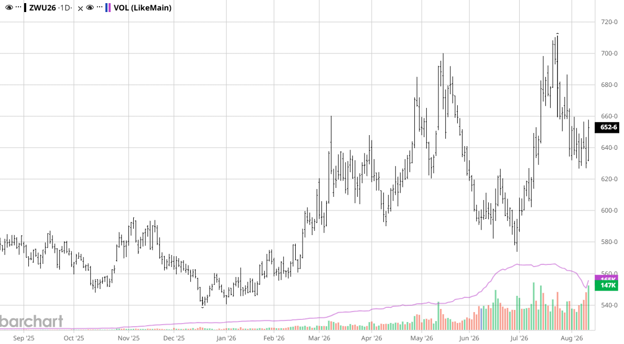
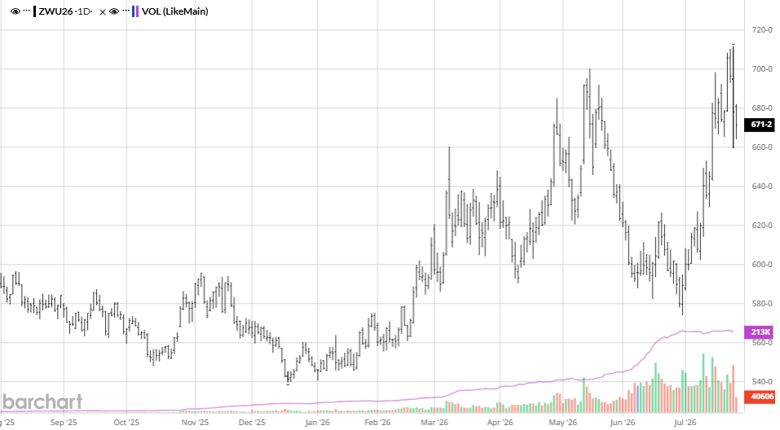
Wheat also caught a bid off the July 10th report, with USDA trimming its wheat production estimate again on continued winter wheat losses, winter wheat production is now seen at just 990.5 million bushels, a 29% drop from a year ago, while spring wheat is projected 4% lower at 475 million bushels, keeping this year’s crop firmly on track to be one of the smallest in decades. Ending stocks fell another 22 million bushels to 722 million on the news, and Chicago wheat jumped over 20 cents to settle at $6.40 that session. The complex has since given back some of those gains as harvest wraps up across the Southern Plains and the market digests early results from this year’s spring wheat crop tour, which came in below both last year’s yield and USDA’s most recent guess, though a bit better than the trade feared. Black Sea supply risk remains part of the backdrop, with Russian consultancy IKAR now pegging Russia’s 2026 crop at 90 million tonnes and export potential at 44.5 million tonnes, keeping traders wary of pricing U.S. wheat too far above what the world actually needs. Export demand has been unremarkable, with last week’s sales total of 10.7 million bushels falling below the four-week average, and the wheat market looks a bit overbought technically after its recent run.

Via Barchart

Equity Markets

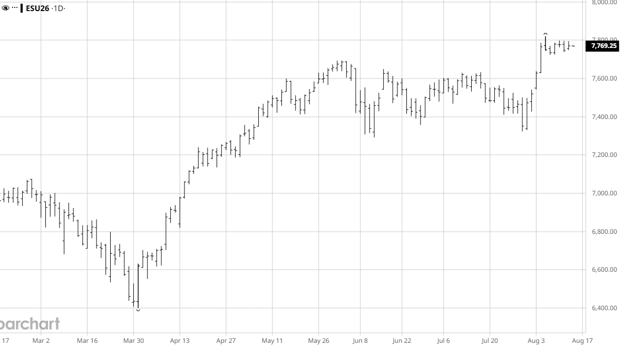
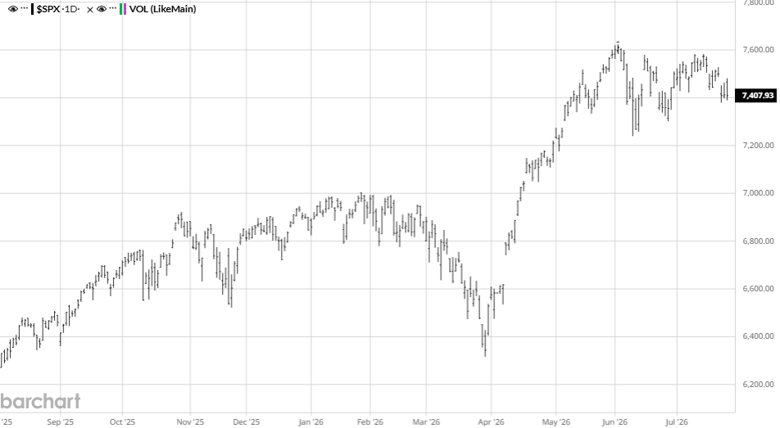
Equity markets pushed to fresh records early in the period, with the Dow topping 53,000 for the first time on July 6th and closing at 52,637 on July 10th, before the reignited Iran conflict and a wave of chip-sector weakness took some wind out of the rally. The Dow closed the week of July 24th at 51,947, still up more than 16% year-over-year, as investors weighed strong Big Tech earnings and continued AI-driven enthusiasm against renewed Middle East headline risk. Volatility has picked up as the market digests a heavy earnings calendar alongside the prospect that persistent inflation could push the Fed toward holding rates steady, or even hiking, rather than cutting further this year.

Via Barchart

Energy Markets

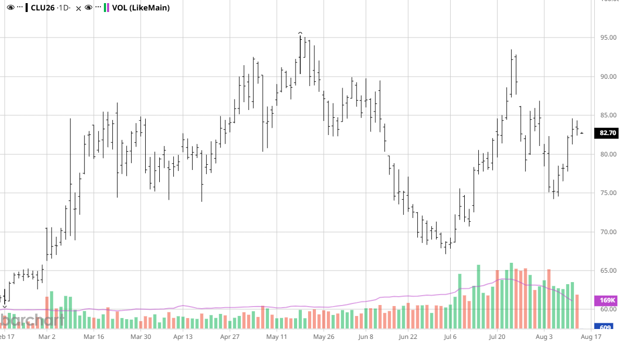
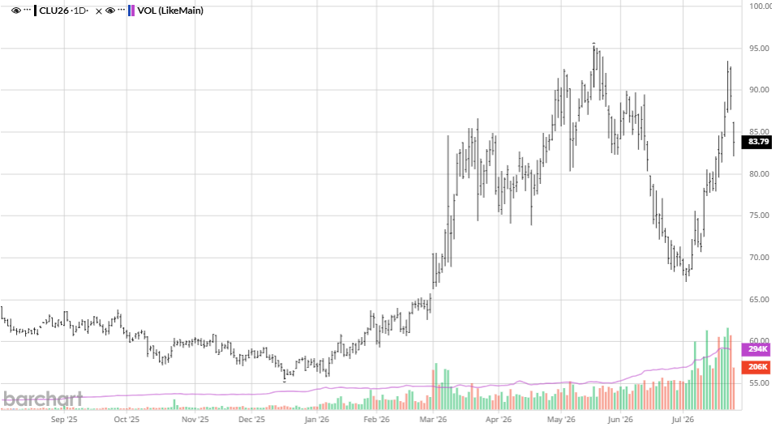
Energy markets were the most volatile corner of the entire complex over the past two weeks as the U.S.-Iran ceasefire that had briefly calmed prices in June completely unraveled. Iran’s attack on a tanker near the Strait of Hormuz on July 7th sent crude sharply higher, and the conflict escalated from there: U.S. forces have carried out repeated rounds of strikes on Iranian targets, Washington reinstated its naval blockade of Iranian ports, and Iran’s Houthi allies in Yemen declared a maritime embargo against Saudi Arabia. WTI crude has been on a wild ride as a result, swinging from the $70 handle in early July to the low-to-mid $80s at points last week, before easing modestly to close out the week as markets try to gauge whether the fighting stays contained. Some analysts now warn Brent could threaten its 2022 high near $128, or even the 2008 peak above $146, in a worst-case escalation scenario. For producers, this is the same fertilizer and diesel cost risk that flared up earlier this year resurfacing, and it is worth watching closely before locking in fall input needs.

Via Barchart

Other News

– Cotton remains a standout, with December cotton settling above 81 cents on July 10th, continuing its run to multi-year highs as elevated crude prices keep synthetic fiber costs up and support natural fiber demand.

– China has been a consistent buyer of new-crop soybeans in recent weeks, and unknown-destination purchases announced late in the period are widely believed to be Chinese business ahead of the Trump-Xi meeting now being targeted for late September.

– USDA’s NASS will be in farmers’ fields conducting the first survey-based yield interviews of the season from July 25th through August 5th, setting up the August 12th WASDE as the next major acreage and yield-driven catalyst.

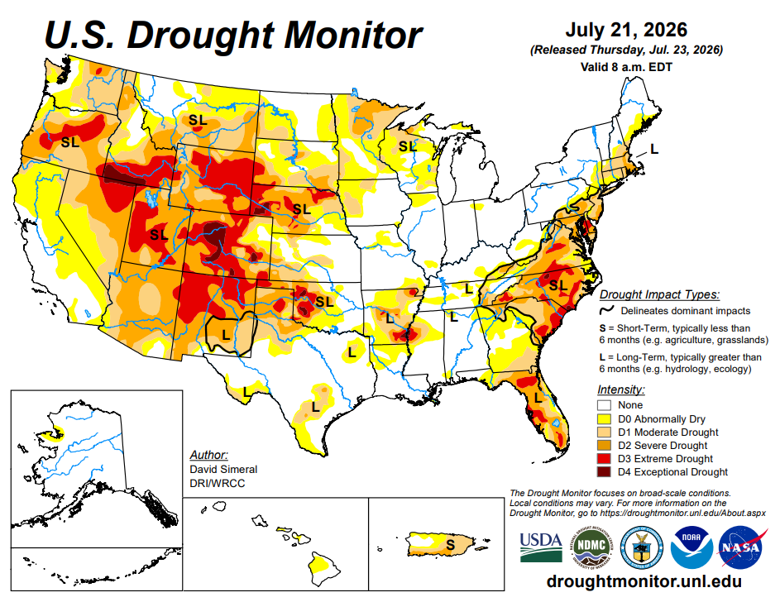
Drought Monitor

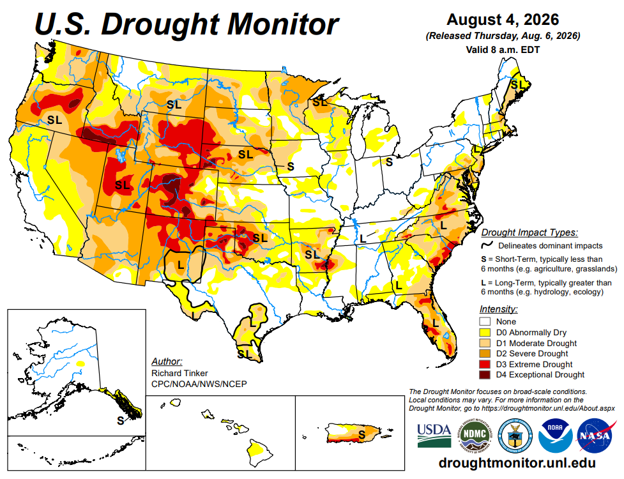
Here is the most recent drought monitor.

Contact an Ag Specialist Today

Whether you’re a producer, end-user, commercial operator, RCM AG Services helps protect revenues and control costs through its suite of hedging tools and network of buyers/sellers- Contact Ag Specialist Brady Lawrence today at 312-858-4049 or blawrence@rcmam.com.


20 Jul 2026

LEONARD LUMBER REPORT: The focus on trade last week was the final liquidation in July

The focus on trade last week was the final liquidation in July, which initially pushed July prices sharply lower and dragged September down with it. By Friday, September had clawed its way back to nearly even on the week. We did hear reports of numerous cracks in some items in the cash market. As of Thursday, we viewed the September break as primarily July-related. By Friday, that view became less certain, and now there is growing concern that a cash adjustment period may be developing. The market should give us that answer early this week.

Heads up: Over roughly the last 10 sessions, there have been consistent iceberg buy orders showing up at various levels in the September contract. Given that the market was in a liquidation period, it initially looked like position exits. However, last week’s Commitment of Traders data suggests it was a combination of short covering and new long accumulation by funds. Typically, their approach is to buy strength to establish long exposure, but in this case they appear to be building a position on weakness.

That raises an important question—why would funds be accumulating a long position under the current economic backdrop? Not sure but I do know if the market is going to rebuild toward 10,000 open interest, it will require meaningful participation from the funds. Whether this activity is the early stages of that shift is something worth watching closely.

The technical read is very straightforward—an if/then setup. The 200-day moving average sits at 639.10, and September came close to that level on Friday. The market has now traded above the 200-day four separate times but has yet to close above it. If the market settles above 639.00, expect a meaningful short-covering spike in the following session. If funds add to long positions at those levels, it signals a shift in the broader trade dynamic.

On the downside, support comes in at 622.50. A break below that level should invite additional selling pressure. The likely catalyst for that move would be increasingly negative cash market reports.

Finally: The market quietly made a new weekly high last week, with 638.50 marking the highest level since August 2025. Both the futures and cash markets remain in a positive cycle that began in October 2025. The question today is not whether the cycle has turned negative, but whether we have entered a corrective phase—and if so, how deep that correction could be, if at all.


Daily Bulletin:

https://www.cmegroup.com/daily_bulletin/current/Section23_Lumber_Options.pdf

Southern Yellow Pine:

https://www.cmegroup.com/markets/agriculture/lumber-and-softs/southern-yellow-pine.volume.html

The Commitment of Traders:

https://www.cftc.gov/dea/futures/other_lf.htm


About the Leonard Report:

The Leonard Lumber Report is a column that focuses on the lumber futures market’s highs and lows and everything else in between. Our very own, Brian Leonard, risk analyst, will provide weekly commentary on the industry’s wood product sectors.


Brian Leonard

bleonard@rcmam.com

312-761-263

13 Jul 2026

LEONARD LUMBER REPORT: September finished the week up $11

This Week:

The September finished the week up $11. It felt a whole lot better than only 11 bucks. This is a supply-driven market rally, and with no layups, the industry can’t trade. It is forcing them to pay up each time. The mills are going along for the ride. If this type of market stays in place—and there is no reason it doesn’t—all will be forced to relish making 3% on a car…..

More of the same.

The spread traded into a plus 1.10 before reversing and resuming the expiration selloff. With futures trading in a slight uptrend, the front month held value for longer. That value tends to erode getting closer to expiration as the focus is on liquidation, while the second month is normally firm. When measuring trends, a change in the spread’s behavior is the first indication of a change in the trade. Put the spread trading over, and we could start to look for much higher numbers.

We are not there yet.

And finally,

I challenge the SYP producers to sell 5 cars at $500 in both September and in November. This is a profitable level for most mills. It makes no sense that the producers aren’t locking in this gift. Georgia has a better chance to beat the Tide then pine staying this high.

The technical read is very interesting.

The futures market has been choppy for 2 years now. In 2026, the trend has been higher highs and higher lows. While it looks like a sideways trade, there is an underlying uptrend. The weekly channel points are 673.50 and 573.90. On Thursday, September takes over with 673.50 as the upside objective. The longer-term read confirms much of our short-term points. 650.00 is a momentum area, as is 609.00. The main takeaway is that the channel is up. The positive momentum is weighted at 30% above 650.00, while the negative momentum is weighted at nearly 60% below 609.00. That indicates that a hedging program should be in place for your inventory. Let’s face it—if you started to hedge already, you are only offsides a few dollars. A rounding error in the grand scheme of things.

July has 875 left open. Historically that is about 97 cars a day. Pretty normal.


Daily Bulletin:

https://www.cmegroup.com/daily_bulletin/current/Section23_Lumber_Options.pdf

Southern Yellow Pine:

https://www.cmegroup.com/markets/agriculture/lumber-and-softs/southern-yellow-pine.volume.html

The Commitment of Traders:

https://www.cftc.gov/dea/futures/other_lf.htm


About the Leonard Report:

The Leonard Lumber Report is a column that focuses on the lumber futures market’s highs and lows and everything else in between. Our very own, Brian Leonard, risk analyst, will provide weekly commentary on the industry’s wood product sectors.


Brian Leonard

bleonard@rcmam.com

312-761-263

13 Jul 2026

AG MARKET UPDATE: JUNE 26 – JULY 10

Corn spent the first half of this stretch grinding to fresh contract lows before finding its footing over the past week, catching a bid on a firming weather-risk premium heading into pollination. The June 30th Acreage and Grain Stocks reports were largely a non-event, with planted acreage at 95.343 million acres, essentially unchanged from the March intentions despite widespread expectations for a cut, and harvested acreage pegged at 87.4 million, down 4% from last year. Friday’s report delivered the bigger surprise: USDA cut 2025/26 old-crop ending stocks 125 million bushels to 2.020 billion, 50 million below expectations, on stronger feed and residual use, while 2026/27 new-crop ending stocks were slashed 170 million bushels to 1.790 billion, a full 80 million below the average guess. Production held at 16.0 billion bushels on an unchanged 183 bu/ac yield, and the season-average farm price was left at $4.40. December corn has worked back into the $4.60s on the tighter stocks numbers and improving Chinese demand optics, though the weather forecast into pollination remains the market’s next major swing factor.
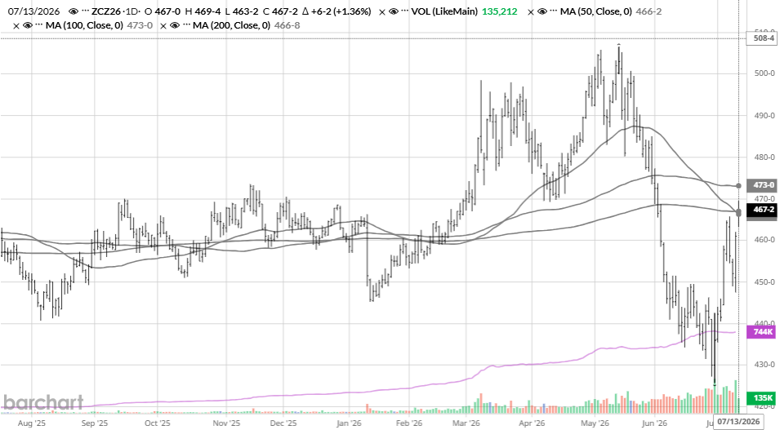
Via Barchart

Soybeans got a mixed signal from the June 30th reports: planted acreage came in at 85.365 million, up 5% from last year and above both the March estimate (84.7 million) and the pre-report trade guess, while June 1 stocks of 1.06 billion bushels, up 5% year-over-year, also landed above expectations, a modestly bearish combination that limited November futures to just a nickel move on report day. The real driver since has been China. After the Commerce Ministry confirmed it would roll back its reciprocal tariff on U.S. ag goods (matched by a cut to the U.S. fentanyl-related tariff), actual purchases followed in short order: a 17.3-million-bushel private sale, another 9.7 million bushels ahead of the WASDE, and Chinese state trader Cofco booking at least six cargoes for September/October shipment. That buying pushed November beans to their best levels in about five weeks, briefly testing the $12 mark. Friday’s WASDE raised 2026/27 production to 4.475 billion bushels on higher harvested acres (yield held at 53 bu/ac), but stronger exports kept ending stocks unchanged at 310 million bushels, still 20 million below expectations, with the season-average price left at $11.40. With crush margins still historically strong, beans remain the more fundamentally supported half of the row-crop trade.
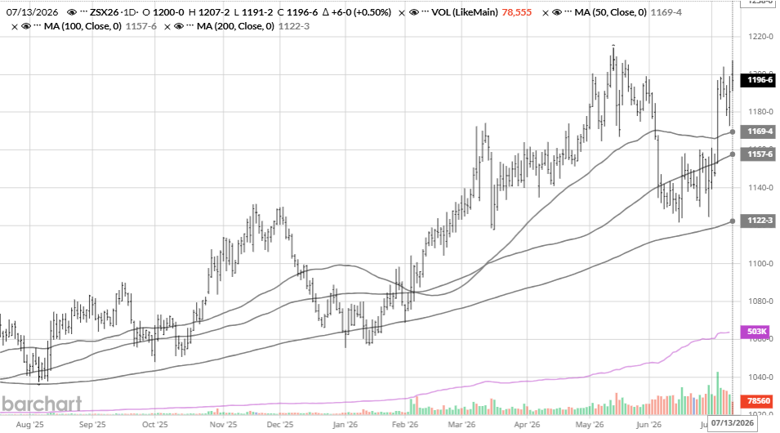
Via Barchart

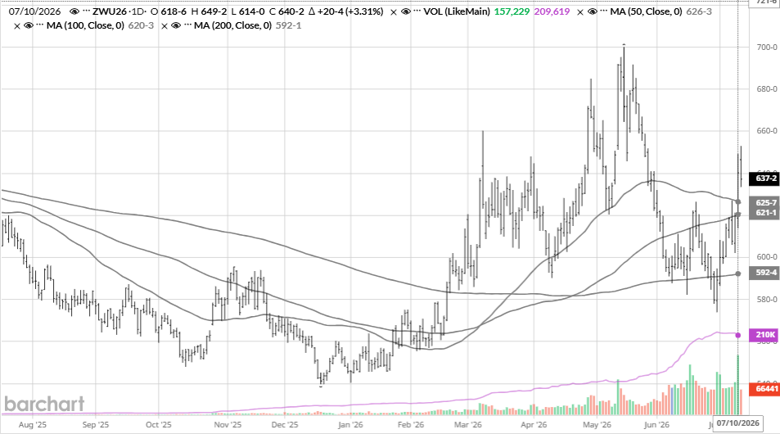
Wheat’s acreage story leaned bullish out of the June 30th report: all-wheat plantings came in at 42.740 million acres, down 6% from last year and below both the March intentions (43.775 million) and the trade guess, with winter wheat acreage at 31.5 million, down 5%. June 1 stocks were up 8% year-over-year at 920 million bushels. Friday’s WASDE confirmed just how tight the new-crop winter wheat situation is: production was cut to 990 million bushels (HRW at 471 million, SRW at 287 million), while stronger spring wheat production (475 million) helped total all-wheat production land at 1.536 billion bushels, the smallest crop since 1970. 2026/27 ending stocks came in at 722 million bushels, and the season-average price held at $6.00.

The bigger story for wheat this week has been geopolitical rather than fundamental. Ukraine’s drone forces reportedly carried out 35 strikes against Russian vessels in the Sea of Azov over a 96-hour span, hitting roughly a quarter of all ships in the area, and there are now unconfirmed reports that Russia may close the Don-Azov Canal and the Kerch Strait in response. With 30-35% of Russian wheat exports moving through that corridor and Russia projected to account for more than 22% of global wheat exports this year, as much as 20 million metric tons of wheat could be bottled up if the closure holds. Chicago wheat spiked more than 2% on Friday to $6.33, its best level since late May, a fast-developing story worth watching closely into next week.
Via Barchart

Equity Markets

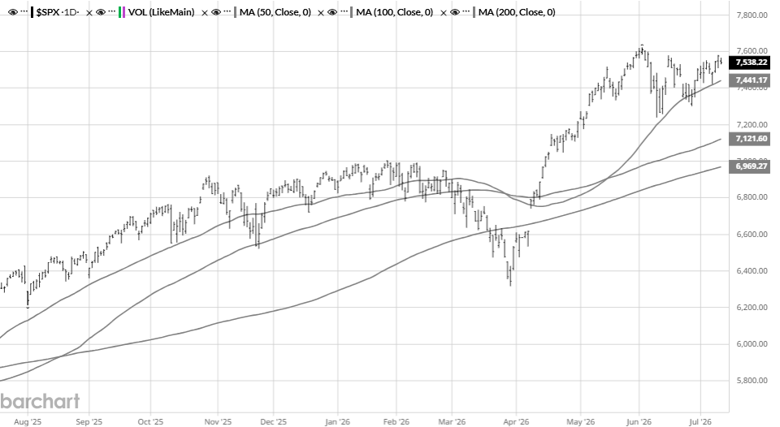
Equity markets closed out an outstanding first half of 2026 and haven’t slowed down since: the Dow gained 8.9% in H1, its best first half since 2021, while the S&P 500 and Nasdaq rose 9.6% and 12%, respectively, and the small-cap Russell 2000 posted its best first half since 1991 at nearly +22%. The Dow has continued notching fresh records since, closing above 53,000 for the first time on July 6th. AI-related names have been choppy, a sharp selloff in Micron, AMD, and Intel on valuation concerns gave way to a renewed rally after SK Hynix’s U.S. share offering came seven times oversubscribed. A soft June jobs report (57,000 vs. roughly 115,000 expected, though unemployment ticked down to 4.2%) and renewed U.S.-Iran hostilities, including fresh U.S. strikes on Iran July 8th, have added some volatility, but the VIX sitting near six-month lows below 16 shows just how much confidence remains in this market.
Via Barchart

Energy Markets

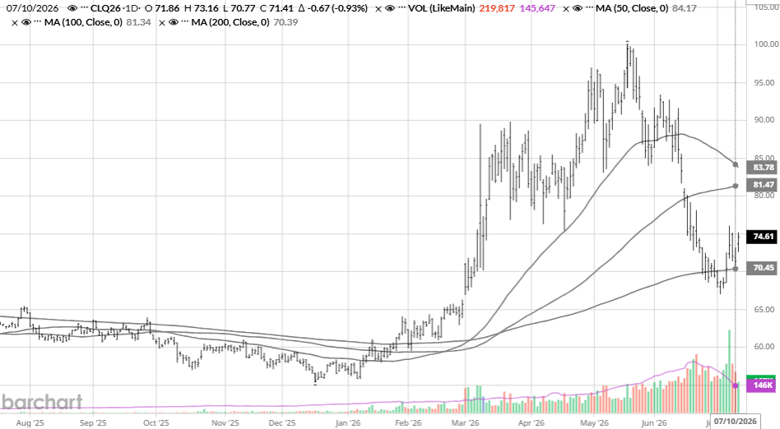
Crude oil has chopped higher since our last update as the Iran conflict flared back up. A weekend of tit-for-tat U.S.-Iran strikes in late June was followed by attacks on three commercial vessels, including a Qatari LNG tanker and a Saudi-flagged crude tanker, near the Strait of Hormuz on July 7th, prompting fresh U.S. strikes on Iran the next day. The Treasury also moved up its deadline on the temporary Iranian oil sanctions waiver, cutting it off July 17th instead of the original August 21st date. Brent has swung from below $70 back above $76, its highest since June 23rd, while WTI trades in the low $70s. The fertilizer and diesel cost relief that had been building since the spring ceasefire has stalled for now, worth keeping an eye on for fall input planning. Note: August crude oil (CLQ26) is approaching expiration later this month, so watch the roll to September when pricing off the front month.
Via Barchart

Other News

– Cotton acreage came in at 9.85 million acres in the June 30th report, up 6% from last year. The July WASDE followed by raising 2026/27 production 400,000 bales to 13.7 million on the larger acreage and a slightly higher yield, pushing ending stocks up 400,000 bales to 4.1 million (a 29.5% stocks-to-use ratio). The season-average price held steady at 73 cents/lb, and December cotton has ridden the broader commodity rally back above 78 cents.

– China’s follow-through on the May Trump-Xi summit commitments has been the clearest bright spot for beans, multiple confirmed purchases (17.3 million bushels, another 9.7 million bushels, and six cargoes booked by Cofco for Sept/Oct) suggest the $17 billion / 25 MMT annual ag purchase pledge is starting to show up in actual export data, not just headlines.

– Ukraine’s drone campaign against Russian shipping in the Sea of Azov has put the Don-Azov Canal and Kerch Strait in question, a fast-developing story that could bottle up a meaningful chunk of Russian wheat exports if the closure holds.

– Renewed U.S. strikes on Iran (July 8th) following attacks on three vessels near the Strait of Hormuz, plus an accelerated Treasury deadline on Iranian oil sanctions relief (now July 17th instead of August 21st), are keeping energy and fertilizer cost uncertainty alive heading into fall input season.

Drought Monitor

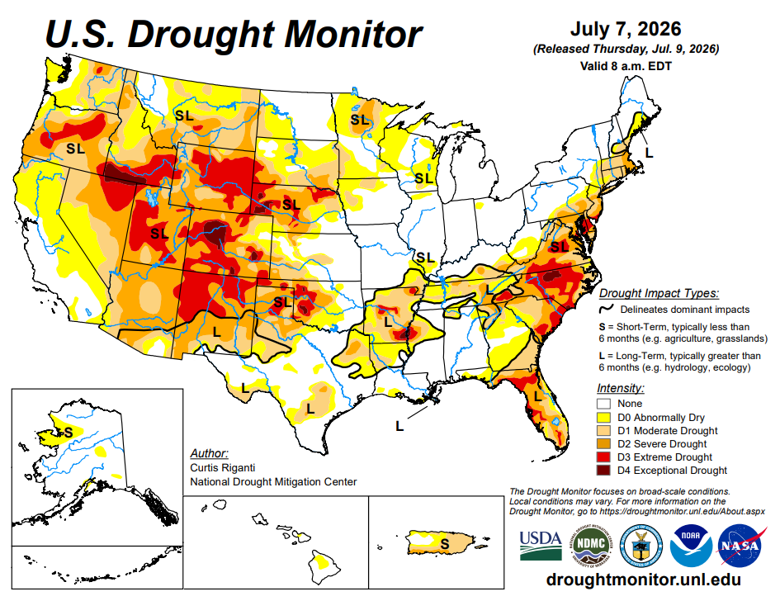
Here is the most recent drought monitor.
Contact an Ag Specialist Today

Whether you’re a producer, end-user, commercial operator, RCM AG Services helps protect revenues and control costs through its suite of hedging tools and network of buyers/sellers — Contact Ag Specialist Brady Lawrence today at 312-858-4049 or blawrence@rcmam.com.

06 Jul 2026

Leonard Lumber Report: Now What?

Now What?

It was a very quiet pre-holiday week, with most of the attention focused on getting out rather than getting in. Who was doing the exiting remains unclear because the COT data is delayed by the Beeks transition. We should get a clearer picture tomorrow.

Price action was uneventful. Most sessions traded sideways on light volume, with Thursday’s modest rally providing the week’s only real spark.

The 620 area continues to act as solid support in both contracts, and the fundamentals appear to support that floor. Ironically, the caution in the market is helping keep takeaway better than expected. We’ve talked all year about the chronically underbought cash market, much of it by design, and that remains true today. If you’re slow, it’s largely because you’ve chosen to stay out of the market.

What we’re seeing now is a trade that wants to get long again—but only at its price. The combination of healthy takeaway and buyer reluctance is giving mills some much-needed confidence to defend levels. If buyers are willing to step up and pay more, it will get done. Until then, expect the standoff to continue.

The longer-term chart continues to support the story. March futures have maintained a strong support line off the April lows, and the technical picture generally confirms the fundamental outlook. It all comes back to the ABC pattern. If that interpretation is correct, the market should gradually work higher from here.

At the same time, let’s not get too far ahead of ourselves. Lumber remains a commodity that can be produced. You may not be able to find studs, but there are plenty of deals on 9-footers. The market has struggled on this one to get every product tight at the same time, and futures are only as strong as the weakest item in the cash market.

That said, today’s market knows there are buyers sweating bullets.

Technical

The technical outlook calls for more of the same, with the possibility of a push back toward the recent highs. With much of the industry sitting flat, the path of least resistance appears to be continued sideways trade with a modest upward bias.


Bottom Line: Buyers remain cautious, mills are gaining confidence, cash is staying firm, and the charts continue to lean constructive. Until something changes materially, expect more of the same—with an edge toward higher prices rather than lower ones. This is not a “punt.” This market does not have a defined trend again. 


Daily Bulletin:

https://www.cmegroup.com/daily_bulletin/current/Section23_Lumber_Options.pdf

Southern Yellow Pine:

https://www.cmegroup.com/markets/agriculture/lumber-and-softs/southern-yellow-pine.volume.html

The Commitment of Traders:

https://www.cftc.gov/dea/futures/other_lf.htm


About the Leonard Report:

The Leonard Lumber Report is a column that focuses on the lumber futures market’s highs and lows and everything else in between. Our very own, Brian Leonard, risk analyst, will provide weekly commentary on the industry’s wood product sectors.


Brian Leonard

bleonard@rcmam.com

312-761-263

29 Jun 2026

LEONARD LUMBER REPORT: The correction finally showed up.

The correction finally showed up.

After weeks of a steady grind higher, July futures gave back $15, working off an overbought condition. Important for the near term—but the bigger story is positioning.

Both sides are heading for the exits.
The long industry is bailing. The short funds are covering.
Positioning has been cleaned up aggressively, and there’s likely more to go.

That’s where it gets interesting for the longer term.

Open interest is shifting in a meaningful way:

– Funds are now net long

– Industry is now net short

That’s not just noise—it tells you something.

The industry has bought enough wood. They no longer need the hedge. That phase is behind us.

At the same time, funds leaning long suggest they’re starting to position for higher ground.

We came into the year looking for this exact transition—and now it’s here.
The economics still point to more upside than downside.

I’m not calling a full fund policy shift yet…
But if that happens, it’s a game-changer.

Now what?

The market remains fragile to the upside—and that’s a supply story, not demand.

The demand looks steady. It’s not the problem.
Supply, on the other hand, continues to ebb and flow with timing and order files. That’s what’s driving the instability.

Because of that setup, the market is highly reactive.
Any outside positive influence—funds stepping in on the buy side, for example—and futures can move higher quickly.

But cut that off, and the tone changes just as fast.
A quiet, non-event summer likely drifts us back toward the lows.

That’s why we’ve been stuck in this flat, grinding range.
We did force the funds out—but it didn’t give us the sharply higher prices we expected.

And that matters.

It tells you the market isn’t weak—it’s just lacking a catalyst. Until something steps in to tip the balance, we’re stuck in a steady, sideways trade with a slight upward bias when flows show up.

Technical:

The RSI in July is 50.30%. The ROC was 2.50 to 1. July closed under the 200-day, and all the momentum indicators have turned down. This remains the B leg down.


Daily Bulletin:

https://www.cmegroup.com/daily_bulletin/current/Section23_Lumber_Options.pdf

Southern Yellow Pine:

https://www.cmegroup.com/markets/agriculture/lumber-and-softs/southern-yellow-pine.volume.html

The Commitment of Traders:

https://www.cftc.gov/dea/futures/other_lf.htm


About the Leonard Report:

The Leonard Lumber Report is a column that focuses on the lumber futures market’s highs and lows and everything else in between. Our very own, Brian Leonard, risk analyst, will provide weekly commentary on the industry’s wood product sectors.


Brian Leonard

bleonard@rcmam.com

312-761-263

26 Jun 2026

AG MARKET UPDATE: JUNE 12 – 26

Corn spent the last two weeks trying to carve out a bottom after the brutal three-week stretch of fund liquidation that ran from Memorial Day into mid-month. Managed Money had been selling aggressively, and while that pace finally cooled, the selling pressure left December corn defending the $4.40 area with the season-average farm price forecast sitting right on top of the market. The catalysts that drove the spring rally have all moved the wrong way: planting weather has been close to ideal, crop establishment across the Corn Belt has been excellent, and crude oil has continued to leak lower as the Iran peace framework has firmed up. With old-crop ending stocks comfortable at 2.145 billion bushels and the new-crop balance sheet described by USDA as essentially unchanged, there has simply been no fresh bullish fuel to pull the funds back to the buy side.

From here, the entire complex is positioning ahead of the June 30th Planted Acreage and Grain Stocks reports, which is far and away the next major scheduled event. Any meaningful deviation from the March Prospective Plantings number, especially given how much chatter there has been about corn acres slipping on elevated fertilizer costs, has the potential to move this market hard in either direction. The other watch item is the calendar itself: as we push toward pollination in July, the weather forecast carries more and more weight, and a hot, dry ridge building over the Corn Belt is the kind of thing that could put a weather premium back into a market that has very little of one priced in right now.

Via Barchart

Soybeans have once again been the more resilient half of the row-crop trade, holding up better than corn even as the same fund liquidation wave washed through the complex. July beans have been hovering in the $11.15 to $11.30 neighborhood, leaning on the tighter fundamental backdrop the May WASDE established, namely that 2026/27 ending stocks projection of just 310 million bushels and the booming crush demand story behind it. Board crush margins north of $3 per bushel remain historically strong and continue to do the heavy lifting on the demand side, with the RFS volumes finalized at record highs providing a structural floor under soybean oil. The drag remains the supply side: planting is all but wrapped up at well over 90% complete, Brazil is sitting on another enormous crop, and U.S. export shipments are still running behind last year’s pace. The long-delayed Trump-Xi meeting remains the wildcard that could flip the demand narrative overnight if a framework actually materializes, but the market has been burned enough times waiting on that headline that it is no longer paying up for it. Like corn, beans are squarely focused on what the June 30th acreage figure does to the new-crop picture.

Via Barchart

Wheat has continued the slide that began once it touched multi-year highs back in mid-May on the historically small U.S. winter wheat crop. The pullback has been driven by harvest pressure now that combines are rolling across the Southern Plains, timely late-May and early-June rains that pulled crop conditions up off the worst-case scenario, and funds booking profits after an extended run. July Chicago SRW has worked down into the high $5.80s and July KC HRW has slid into the low $6.30s. The important thing to remember is that nothing about the supply story has actually changed, this is still projected to be the smallest domestic wheat harvest since 1965, so the question is whether harvest lows are in or whether the seasonal pressure has more to run. Watch the pace of harvest results, spring wheat conditions in the Northern Plains, and whether the recent rains were enough to truly stabilize the HRW crop or just a temporary reprieve.

Via Barchart

Equity Markets

Equity markets have extended their remarkable run, with the major indexes pushing to fresh records even as volatility has picked up and some of the high-flying AI names have seen sharp, fast bouts of profit-taking. The dominant tension remains inflation: with price data still running hot, a growing share of investors now believes the Fed’s next move could be a rate hike before year-end rather than another cut, a notable shift in expectations. For now, the AI trade and strong earnings tone have been enough to keep dip-buyers in control, but the market feels increasingly two-sided after such a long stretch of one-way gains.

Via Barchart

Energy Markets

Crude oil has remained the single most important variable for the entire ag complex, and the direction has been lower. WTI has continued to retreat from its spring highs above $110 per barrel as the Iran peace negotiations have progressed, with the apparent Memorandum of Understanding to wind down the Middle East conflict taking crude back below $85 to close out the prior period and keeping pressure on prices since. The reopening of the Strait of Hormuz to international shipping is reportedly part of the framework, and if that holds, the war premium that propped up the grain complex this spring continues to bleed out. The practical takeaway for producers is that fertilizer cost relief is finally becoming more than partial, nitrogen and diesel have eased off their wartime peaks, though prices are not yet all the way back to pre-conflict norms.

Via Barchart

Other News

– The June 30th USDA Planted Acreage and Grain Stocks reports are the dominant near-term event for the entire complex. With so much debate over whether high fertilizer costs trimmed corn acres from the March intentions, and whether beans picked up the difference, any surprise in the final acreage figures will be a significant market mover heading into July.

– The New World screwworm situation in Texas continues to be monitored after its first mention in the WASDE narrative last month, a reminder that animal agriculture is carrying its own emerging risks alongside the geopolitical backdrop.

– Cotton has continued to drift with the broader commodity complex as crude has retreated, peeling away some of the energy-driven premium that had made natural fiber more attractive versus petroleum-based synthetics. Producers who can lock in profitable margins at current levels while keeping upside participation should continue to evaluate their hedging options.

– Any concrete movement on a Trump-Xi meeting remains the most important demand-side wildcard for soybeans. A genuine resumption of Chinese buying would change the bean story quickly, but the market has stopped pricing it in until it actually happens.


Drought Monitor

Here is the most recent drought monitor.
Contact an Ag Specialist Today

Whether you’re a producer, end-user, commercial operator, RCM AG Services helps protect revenues and control costs through its suite of hedging tools and network of buyers/sellers.

Contact Ag Specialist Brady Lawrence today at 312-858-4049 or blawrence@rcmam.com.



22 Jun 2026

LEONARD LUMBER REPORT: Futures kept working higher last week

The grind higher continues.
Futures kept working higher last week, but you’re starting to feel the weight of an overbought market. Cash didn’t care—it pushed higher again. The pipeline is still a question mark, but what matters right now is simple:
there’s business getting done every day, and it’s getting done at higher levels.

Mills deserve some credit here. They cleared out excess a few weeks back ahead of this buy wave, and now they’re sitting in a position of control. Files are in good shape, and because of that: A futures pullback doesn’t ripple into cash. Not right now. It’s that tight.


Under the surface, positioning:

– Funds are buying back shorts—but not nearly at the pace of industry selling

– Result: open interest is falling off hard

That matters.

At this rate, the industry is on track to not be hedged.
That’s not a small shift—it changes how this market behaves.


And here’s the miss:

The market never got the volatility in cash that people expected.
No air pockets, no panic resets—just a steady tightening and grind. Now, keep draining open interest—another ~1,000 contracts—and you likely start to see it: Volatility comes back. Not because of weakness, but because the market loses participation and depth.
Less hedging, thinner structure → faster, sharper moves both ways.


Bottom line:

– Cash is in control and not fragile

– Industry is exiting cleanly without damage

– Open interest collapse is the real story


One more thing worth noting:

As of this writing, the RSI in the CA$ is sitting at ~7%. That’s not just oversold—that’s extreme. About as washed out as it gets, outside of the negative crude episode.

So, what is it?

Is the Canadian economy really that weak? Or is this just a currency trade?

Hard to argue it’s purely macro deterioration at that level. This feels more like:

– Positioning stretched to one side

– USD strength / CAD weakness feeding the move

– Flows dominating fundamentals in the short term

When you get readings this extreme, it’s usually not about “fair value”—it’s about imbalance.


Technical:

Technically, this has largely done the work.

Strip out the 86.70 July RSI and the read turns constructive.
We cleared the 61% retrace at 621.20 and held—momentum confirmed. What next?

Setup:

– 80/20 now → 90/10 next week

– Move is mature, but not dead


Positioning:

– Short risk is fading

– Don’t lift hedges—scale them, take profit

– Re-hedging on the short side is required


Cycle hasn’t changed:

Too much wood to not enough and then too much again


Bottom line:

Distributors got saved.
Don’t give it back.


Daily Bulletin:

https://www.cmegroup.com/daily_bulletin/current/Section23_Lumber_Options.pdf

Southern Yellow Pine:

https://www.cmegroup.com/markets/agriculture/lumber-and-softs/southern-yellow-pine.volume.html

The Commitment of Traders:

https://www.cftc.gov/dea/futures/other_lf.htm


About the Leonard Report:

The Leonard Lumber Report is a column that focuses on the lumber futures market’s highs and lows and everything else in between. Our very own, Brian Leonard, risk analyst, will provide weekly commentary on the industry’s wood product sectors.


Brian Leonard

bleonard@rcmam.com

312-761-263