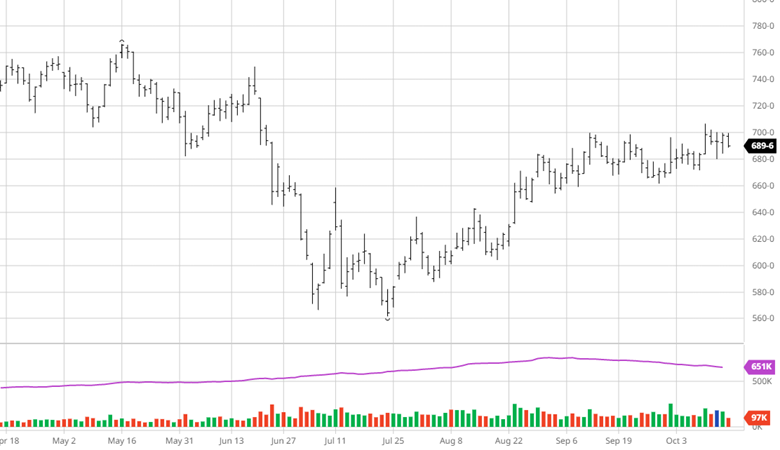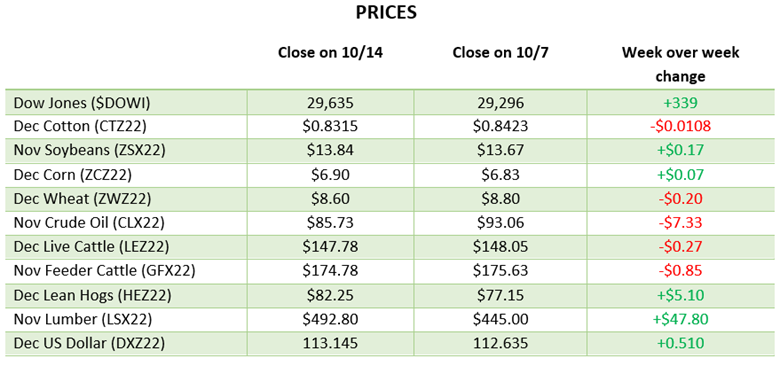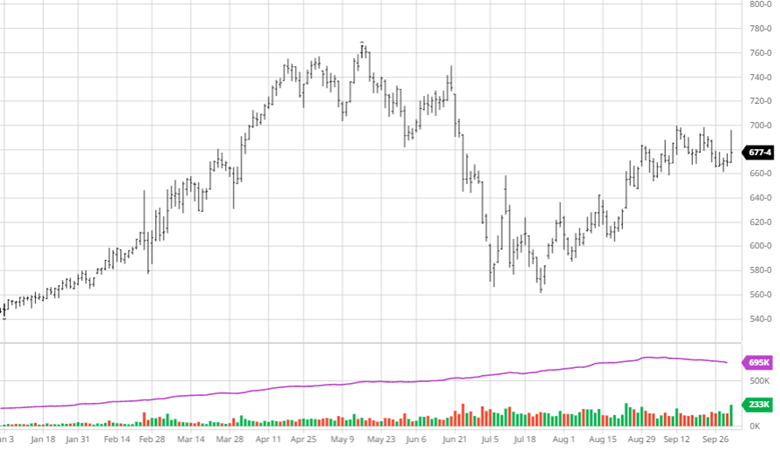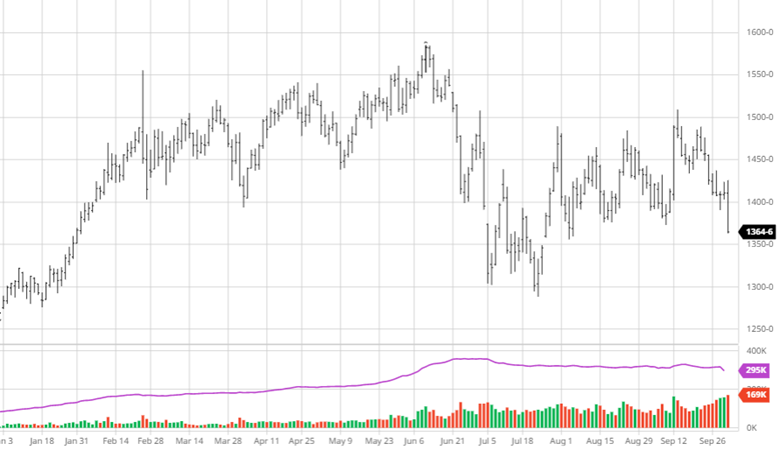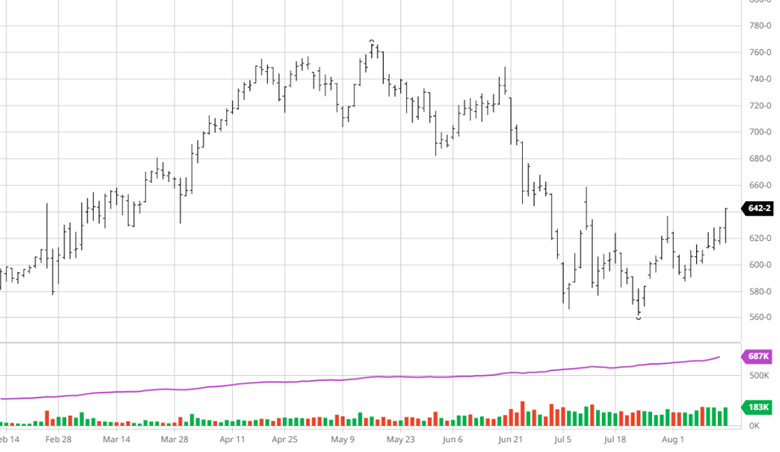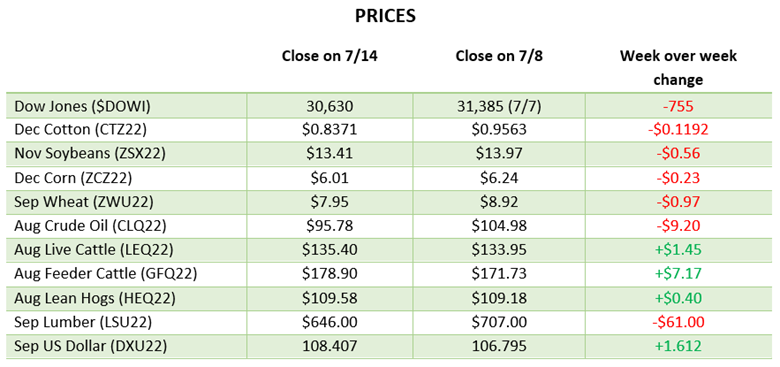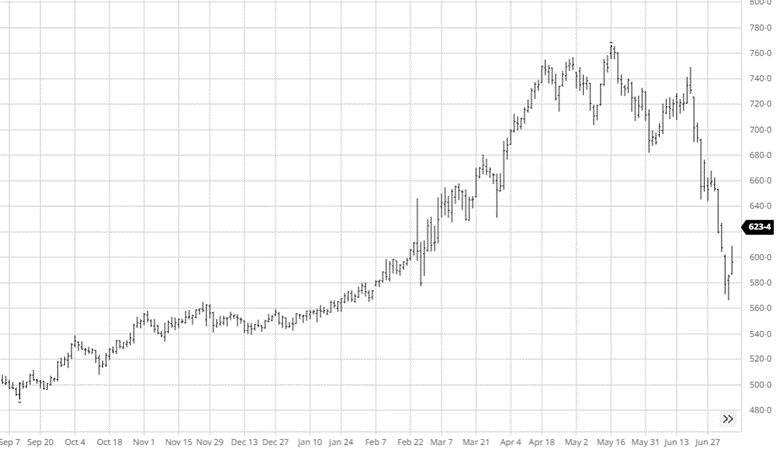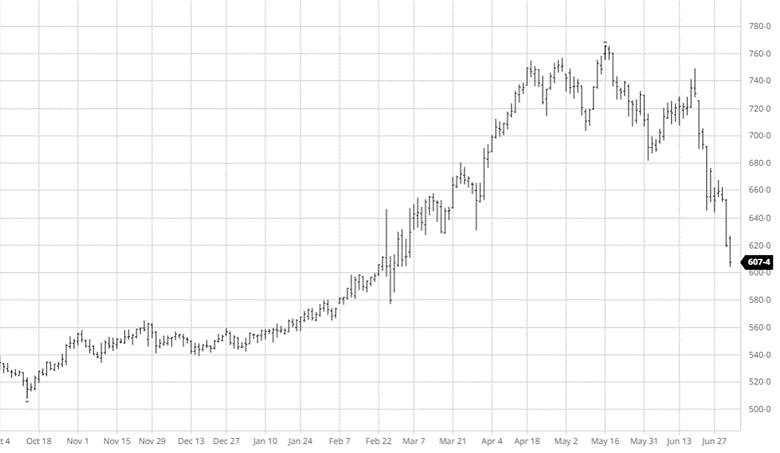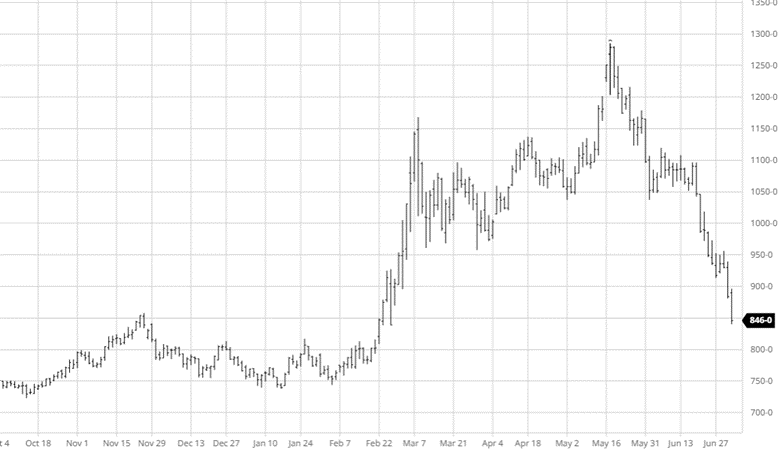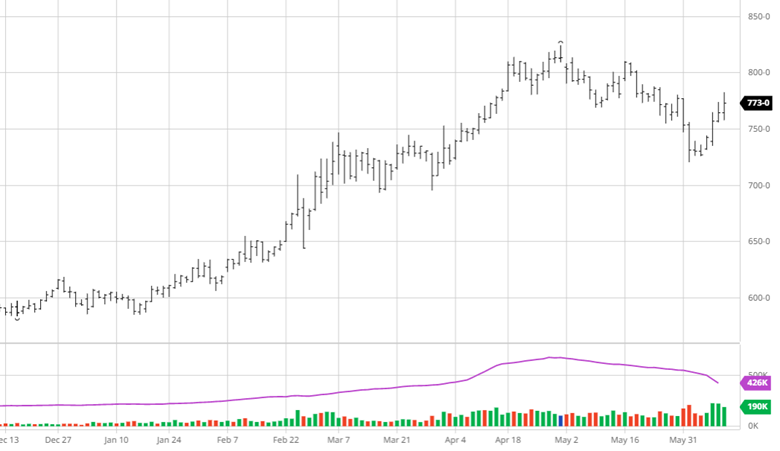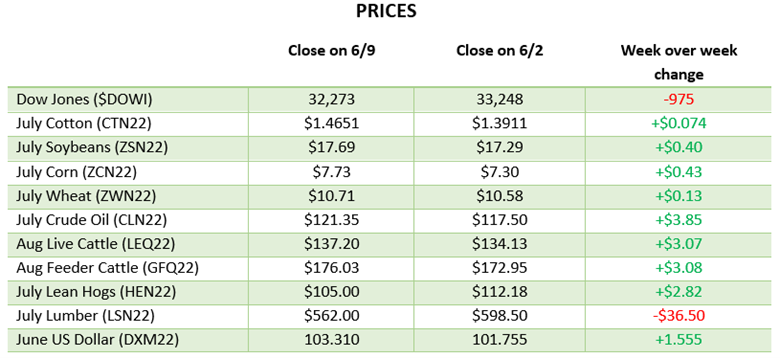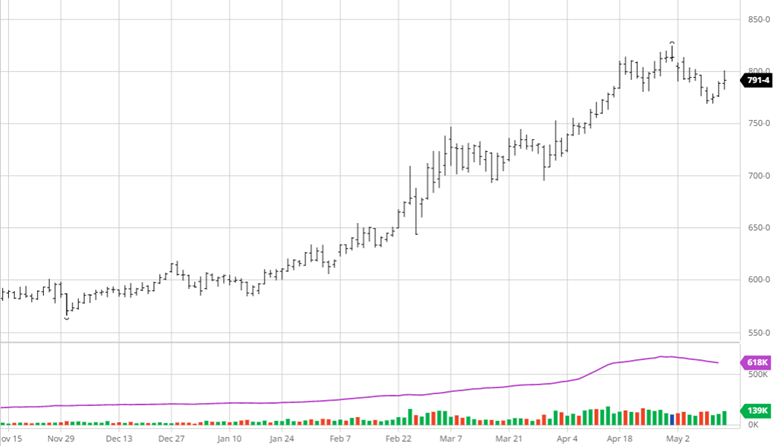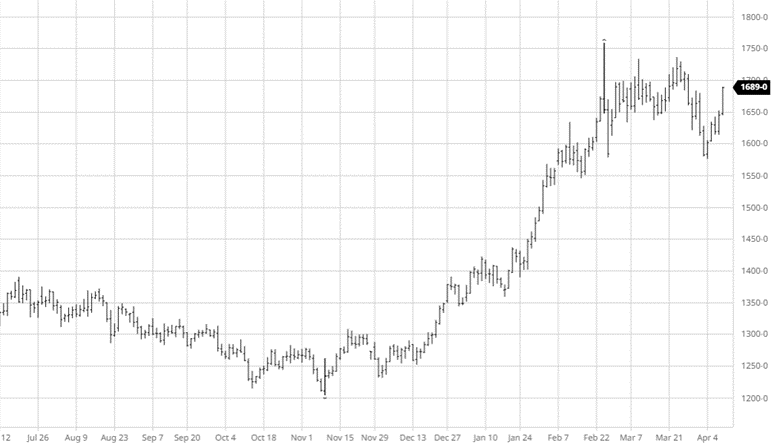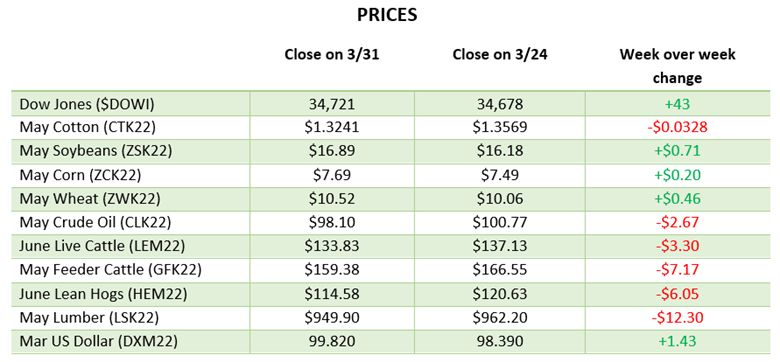


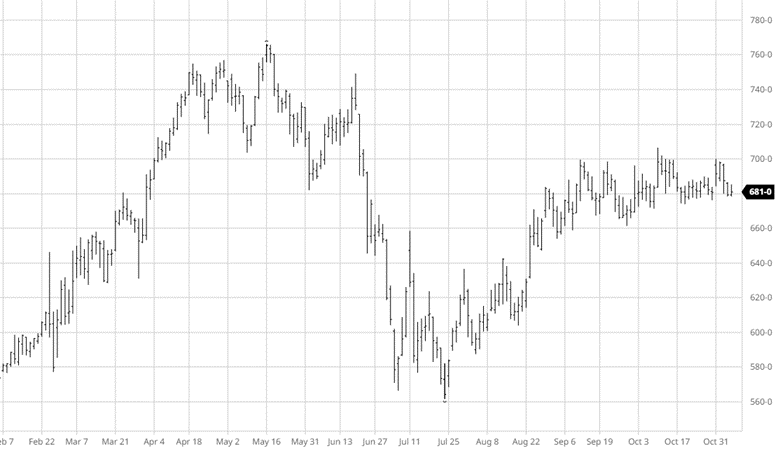
Corn had small losses on the week again as it has been range bound the last month. The market holding at this level certainly is not a bad thing when it traded $1 lower than current levels in July, it just needs a catalyst to push it one way or the other. The catalyst could be next week’s USDA Report as there could always be a surprise or two for the market. Many estimates see the USDA raising production from the October estimates, but by how much will be the question. Ultimately with US harvest coming to a close and South America ramping up, the global outlook and weather will begin to dominate the markets. The US will also need plenty of moisture over the coming weeks and winter to 1. Raise river levels to help grain exports and 2. Improve subsoil moisture heading into 2023. Exports remain underwhelming and will likely be lowered for the year in next week’s report.

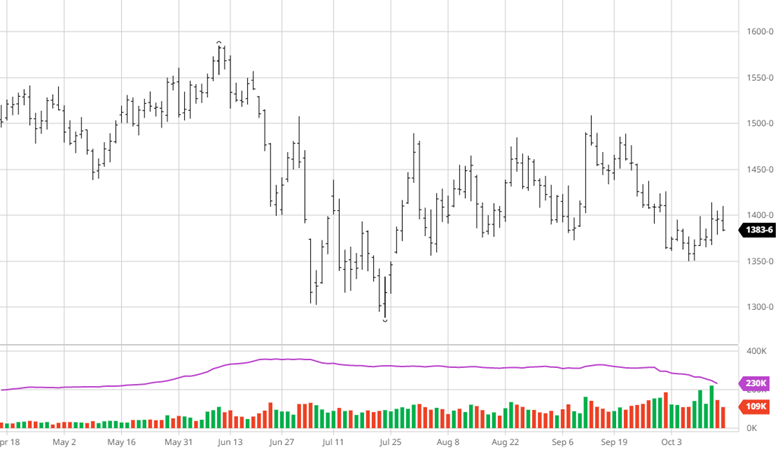
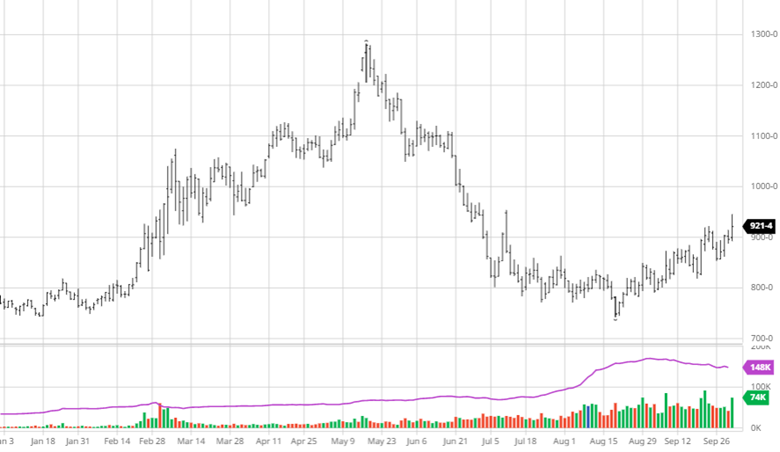
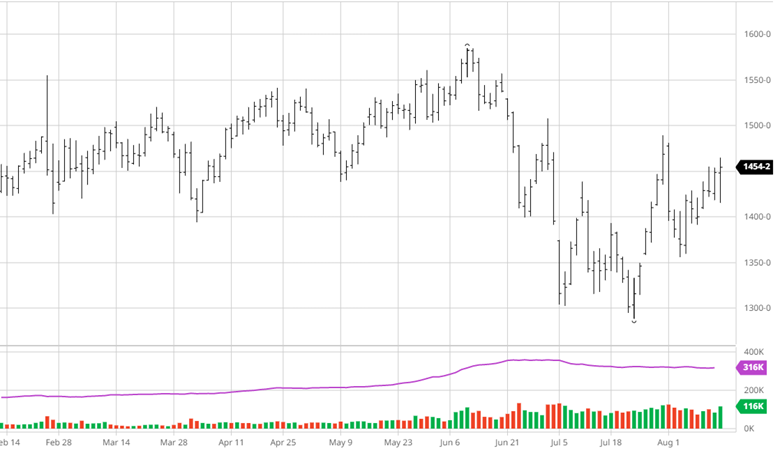
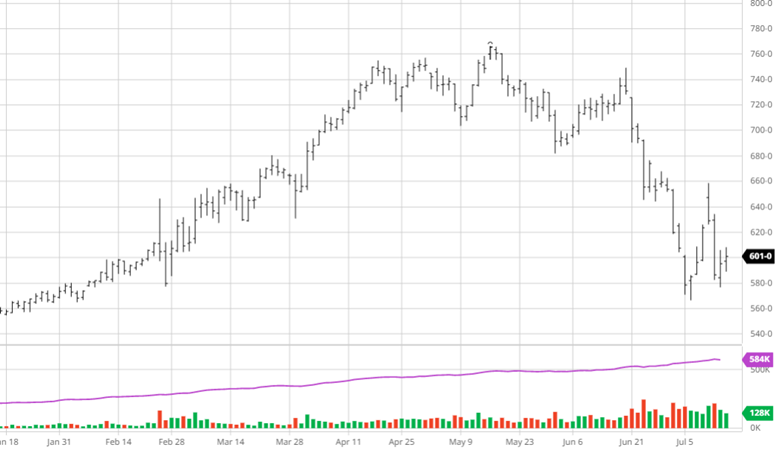
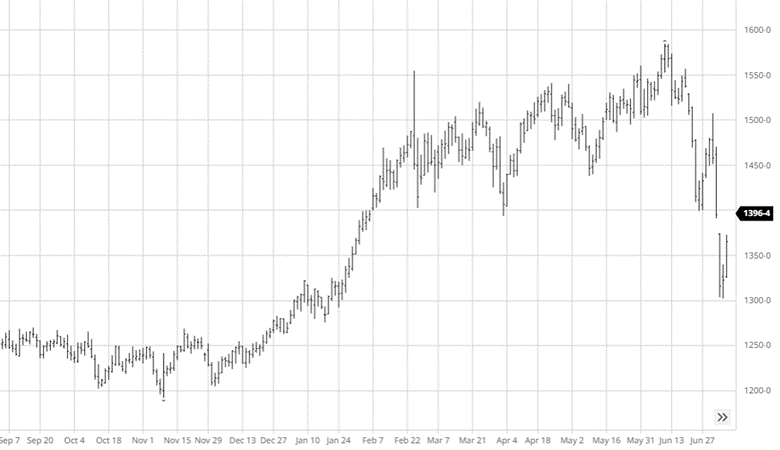
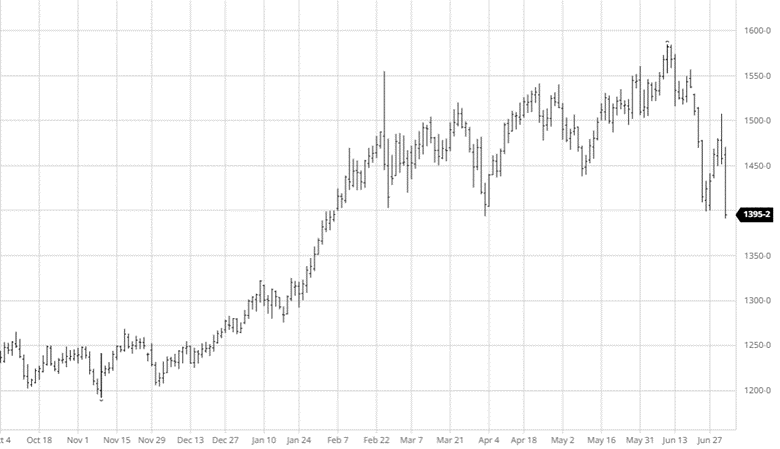
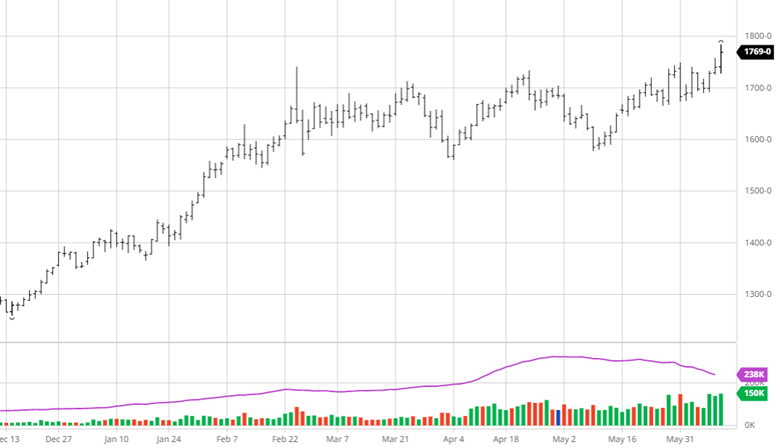
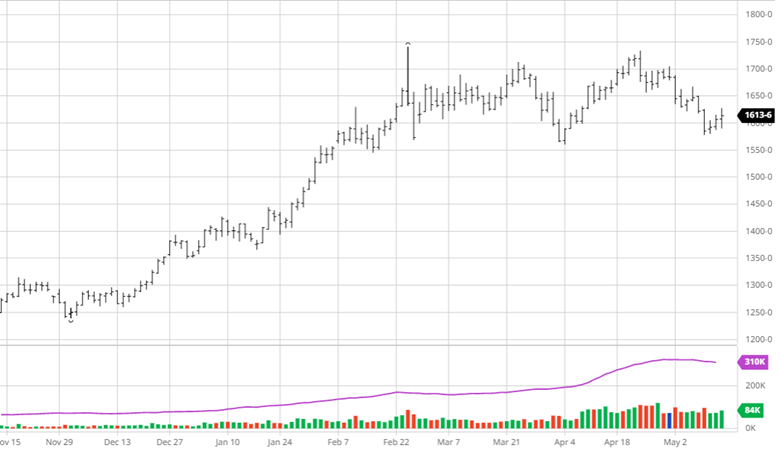
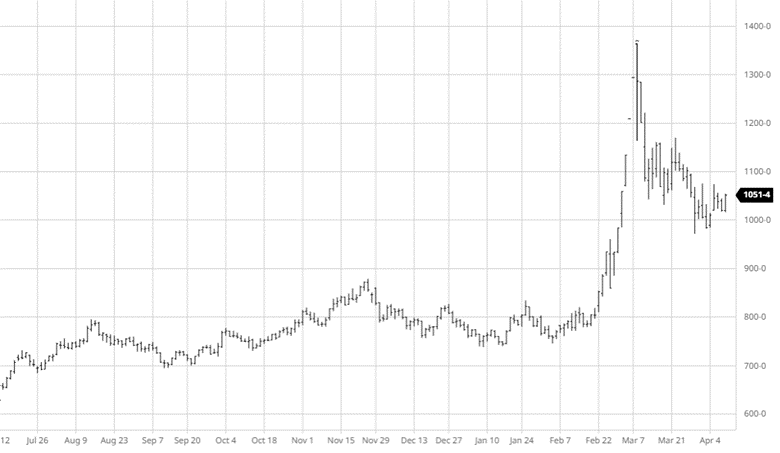
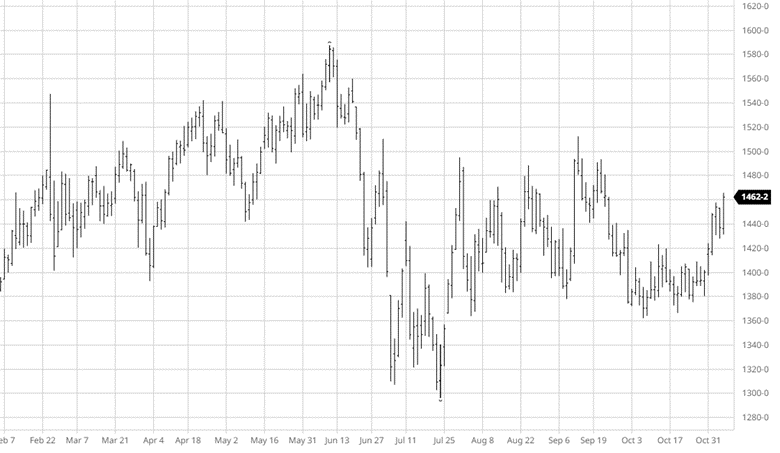
Unlike Corn, Beans have had a much wider range after an initial flat start to harvest have rallied back hard over the past 2 weeks. This move higher is welcome and appears to be heading toward a test of the highs from early September – can it break through? The USDA report will be the big news next week along with any news out of South America for weather and China potentially coming out of zero covid restrictions. Like corn, the USDA will likely raise US production next week and may lower exports. For any sustained move higher China will need to be a regular buyer and South American conditions would need to become less favorable.

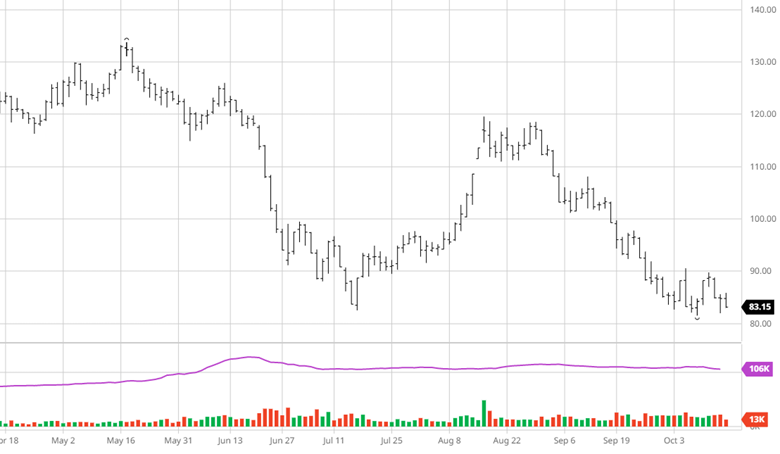
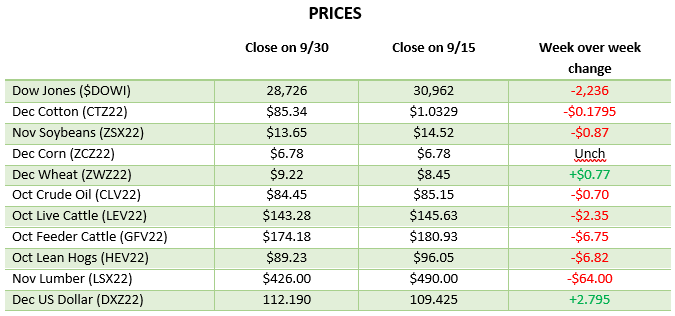
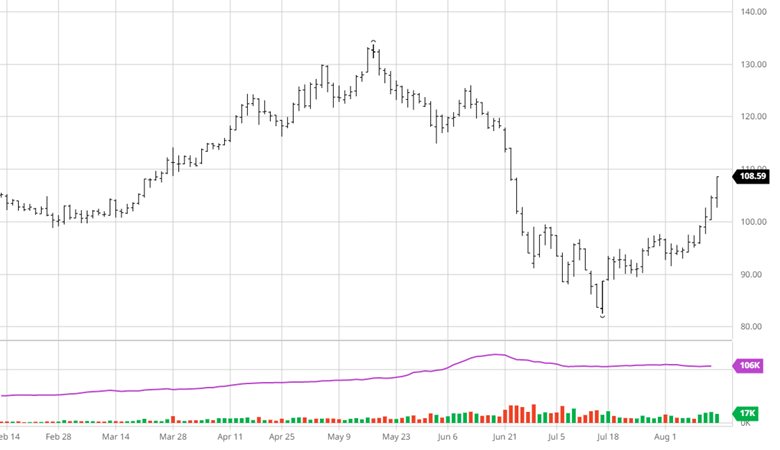
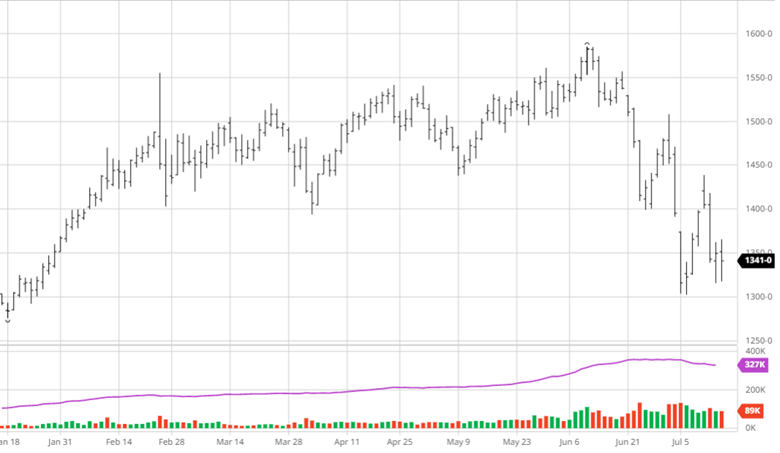
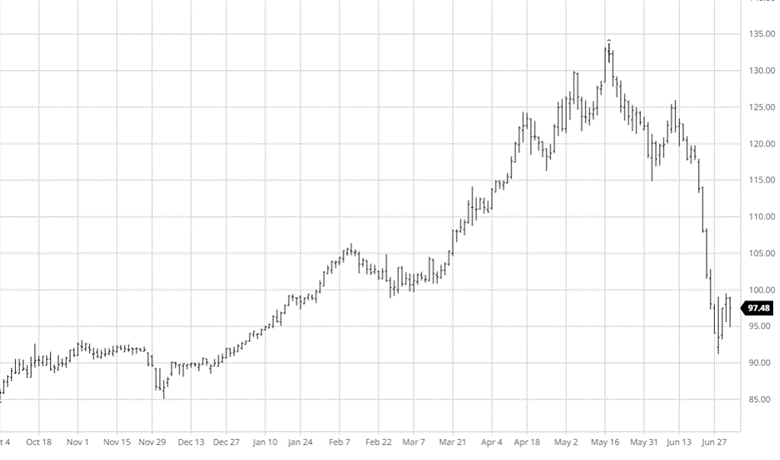
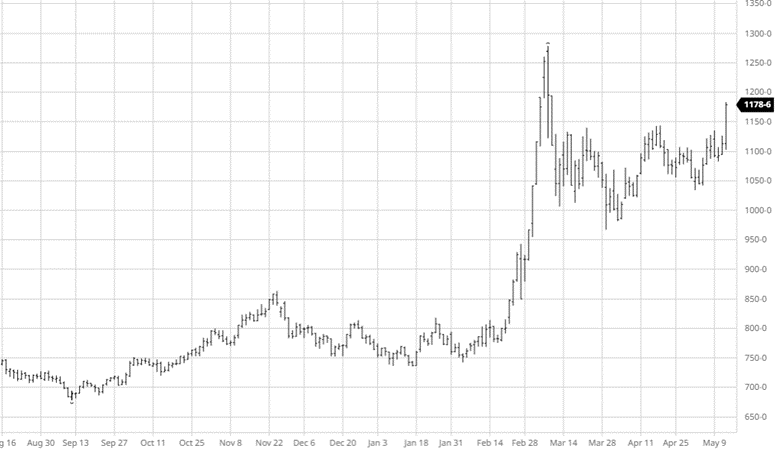
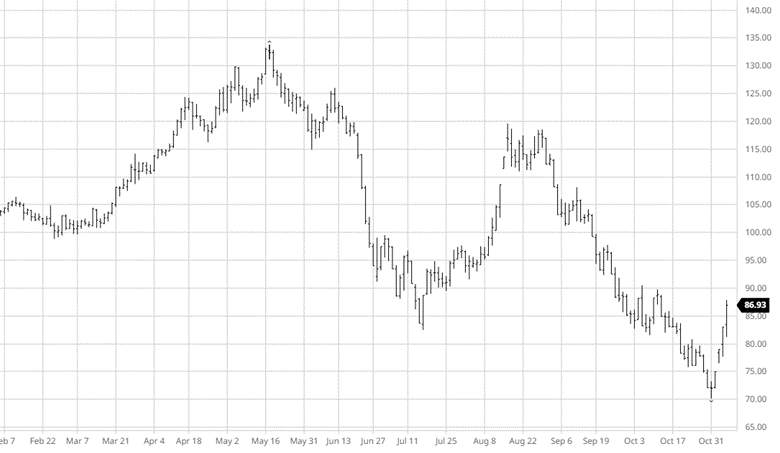
Cotton has had quite the week with 4 days that traded limit up at one point. With a lot of speculative positions in the market being short, this could be seen as a short covering rally as specs must exit their positions before expiration. On the physical side, the global cash market is a mess. Mills have massive inventories of both cotton and converted goods with no companies buying. The lack of buying by apparel companies shows their concern for the holiday season as inflation and market uncertainty will weigh on spending this year.

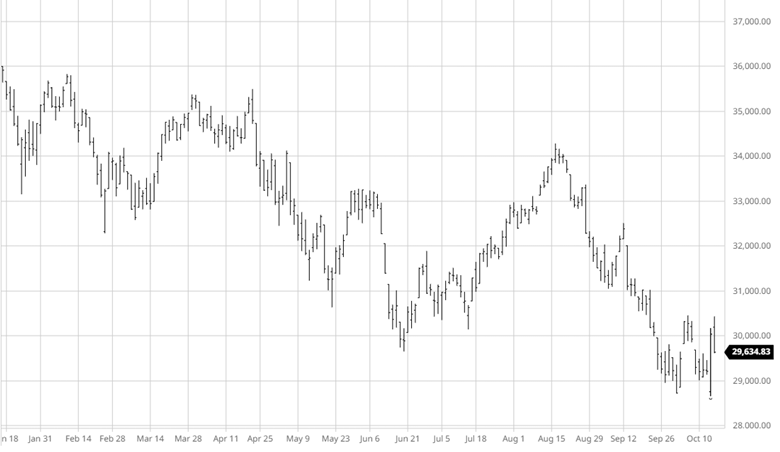
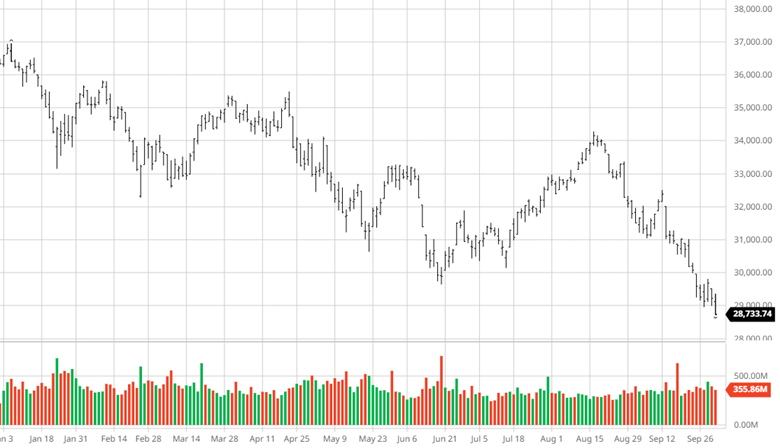
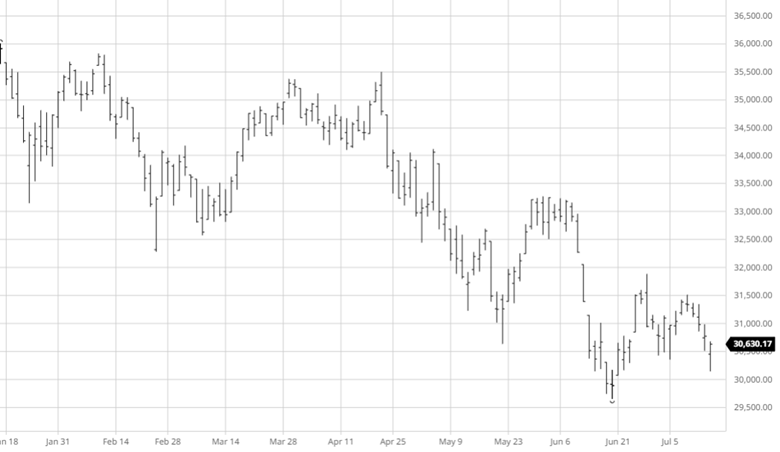
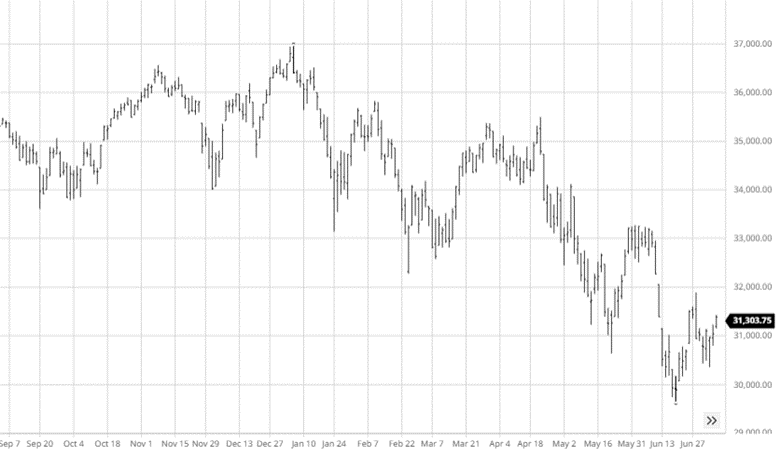
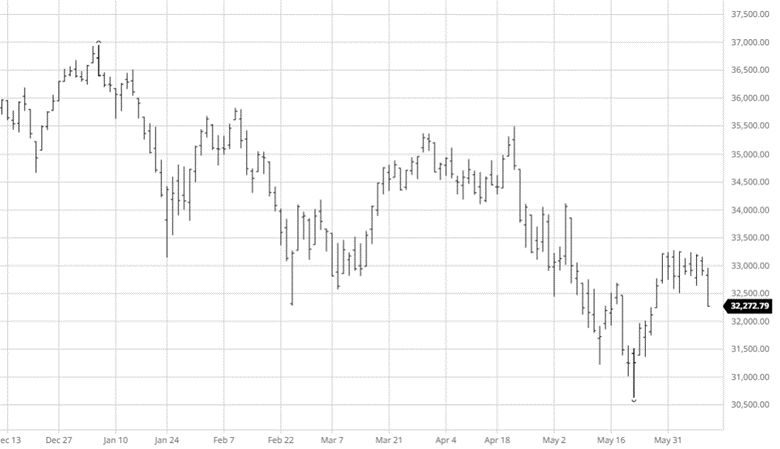
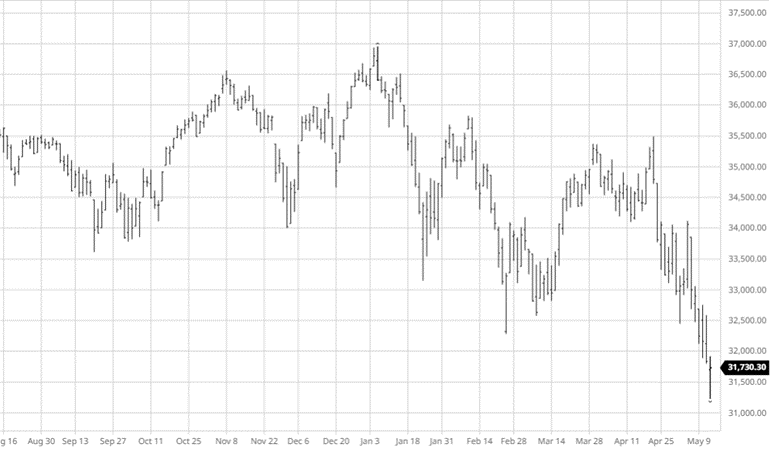
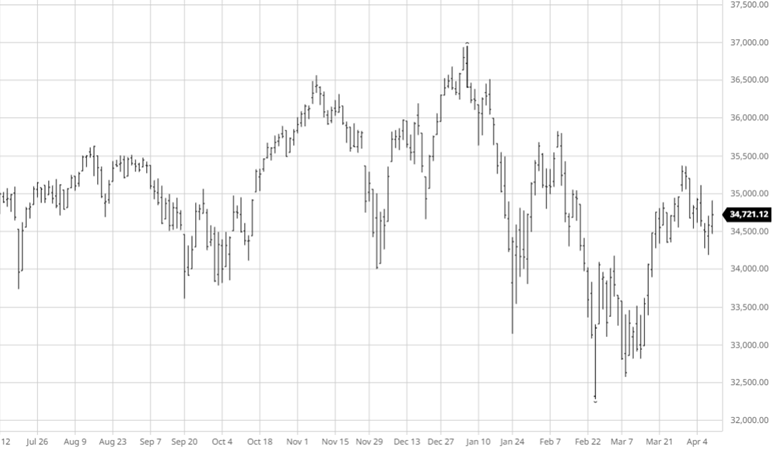
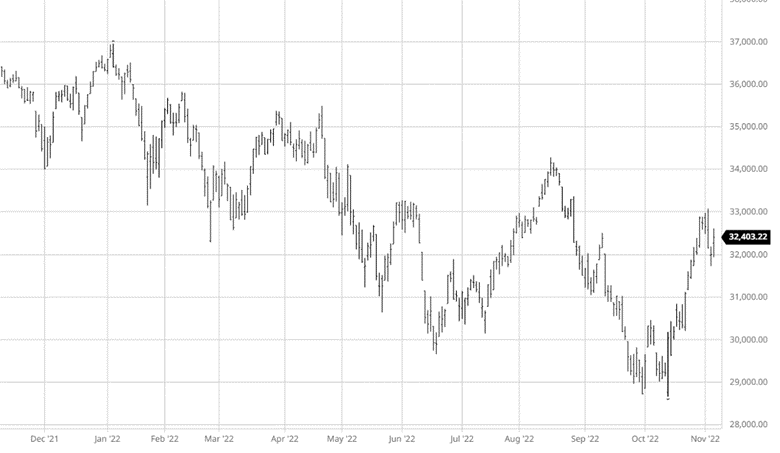
Equity Markets
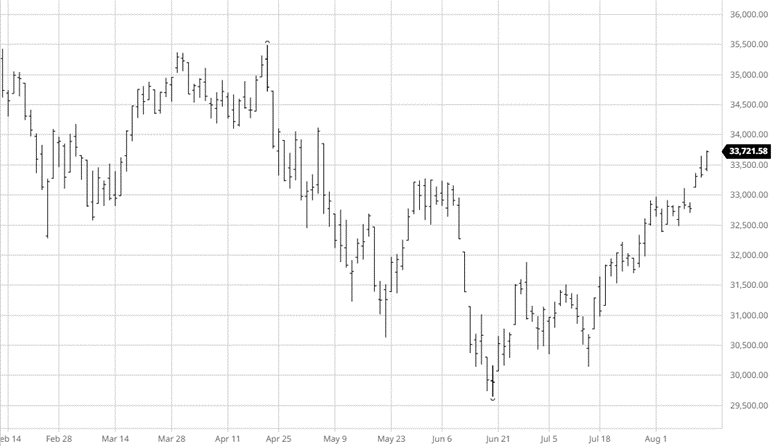
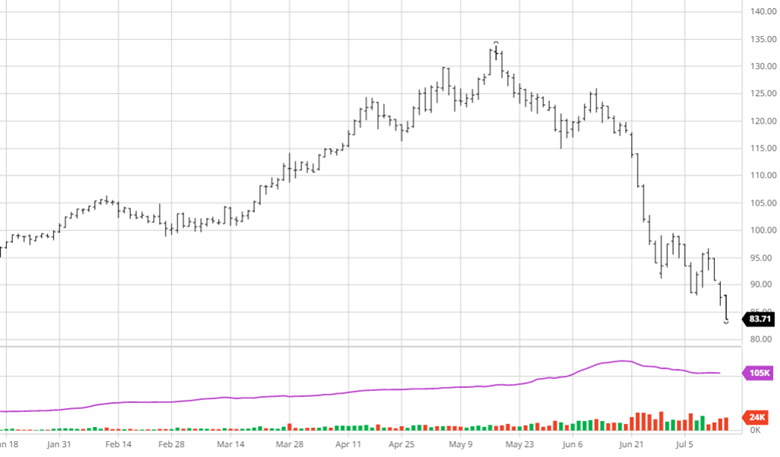
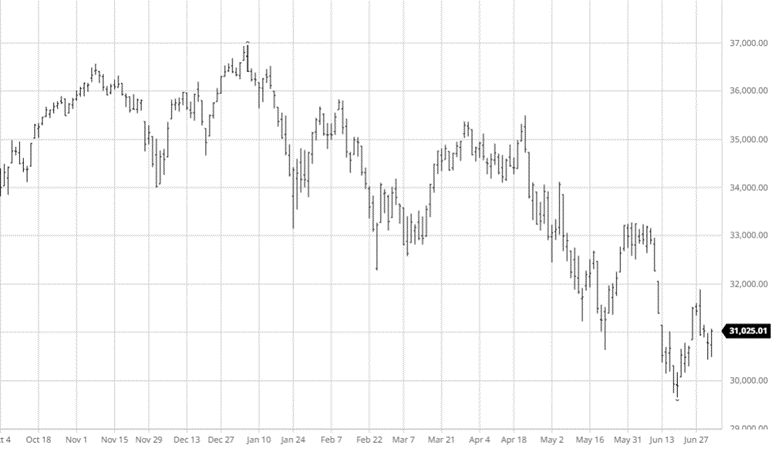
The equity markets have gained over the last 2 weeks; however, gains were muted after the Fed raised rates another 75 points earlier this week. This was expected but the comments by chair Powell after they came out were more hawkish than expected setting up an interesting point in next month’s meeting. Powell said the Fed is not likely to slow down yet setting up the potential for another 75 points in December, while analysts were leaning towards 50 before he spoke. The unemployment rate did tick higher in October while many companies also announced hiring freezes and grim outlooks for the first half of 2023. Crude oil spiked back above $90 a barrel on Friday continuing to bolster energy stocks. Midterm elections next week will also be closely watched as it may lay out what, if anything, will be done over the next 2 years.
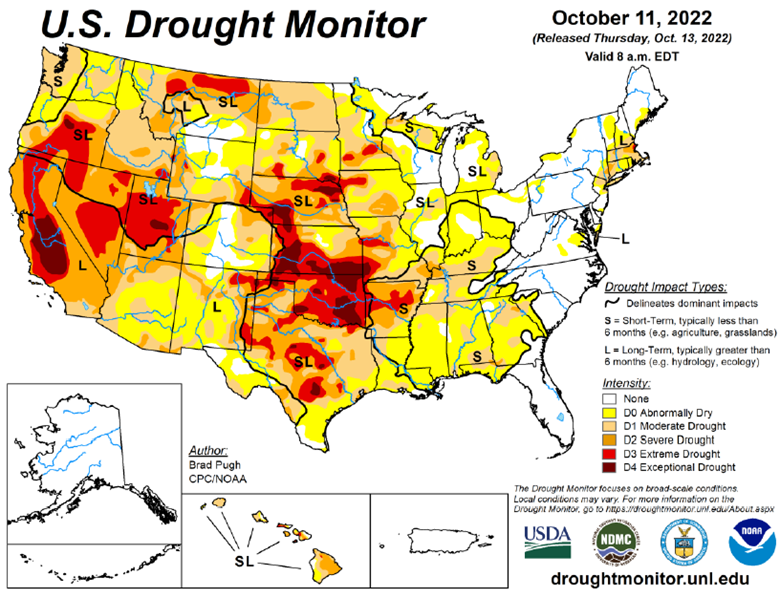
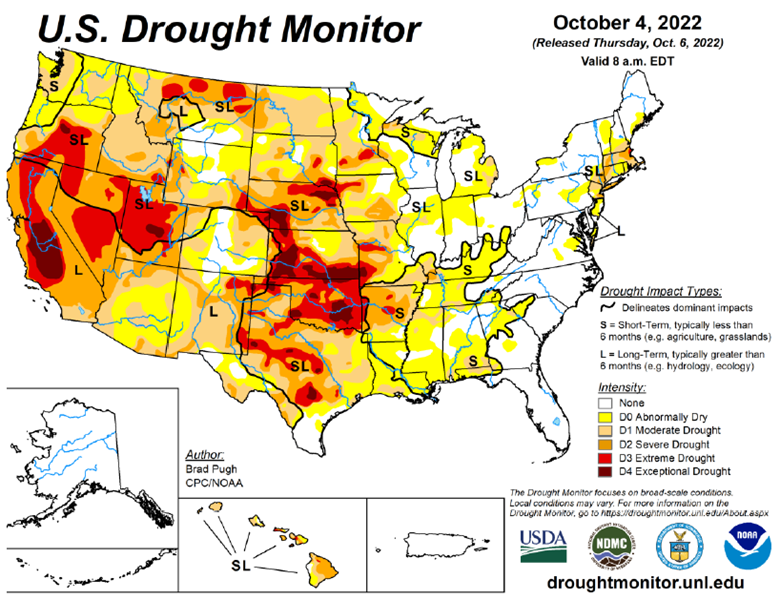
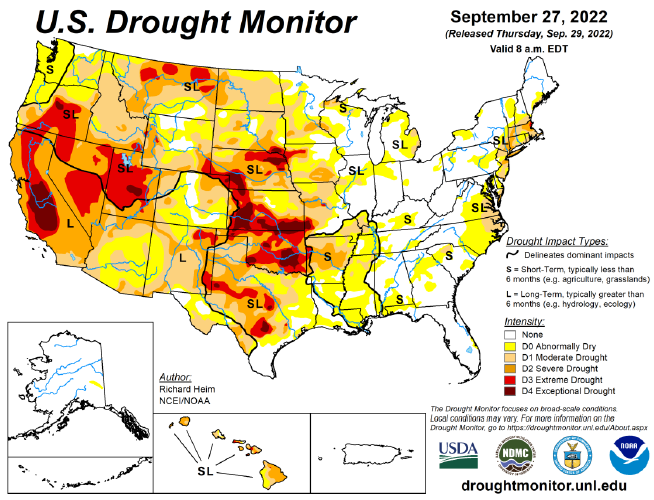
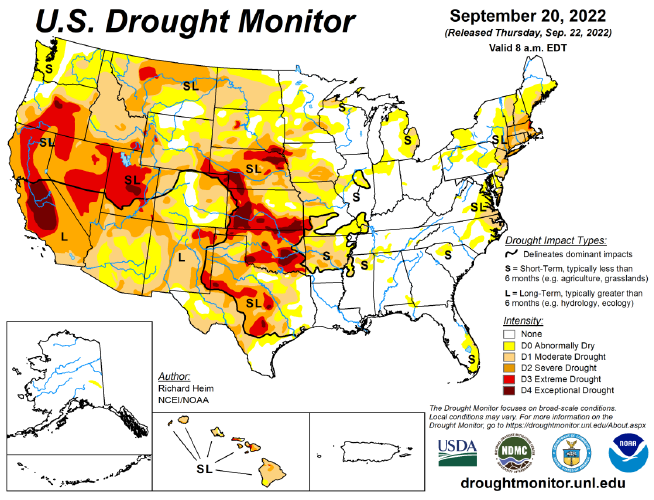
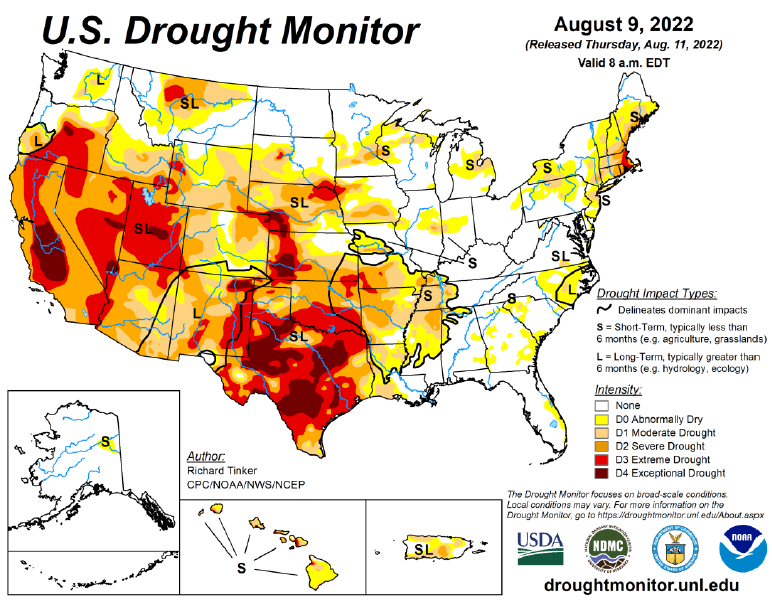
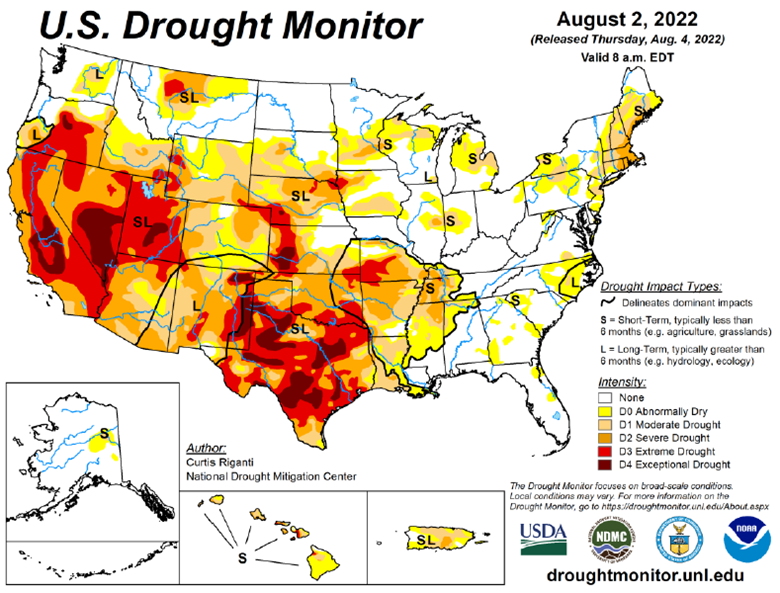
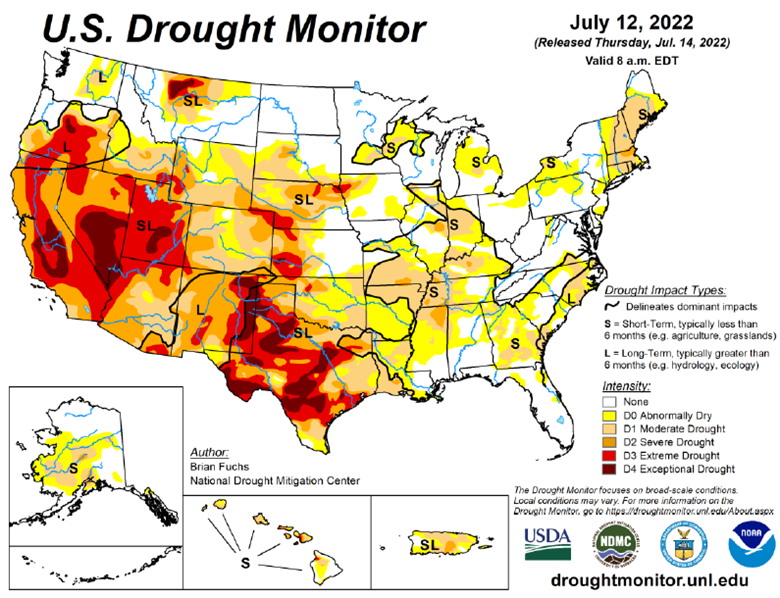
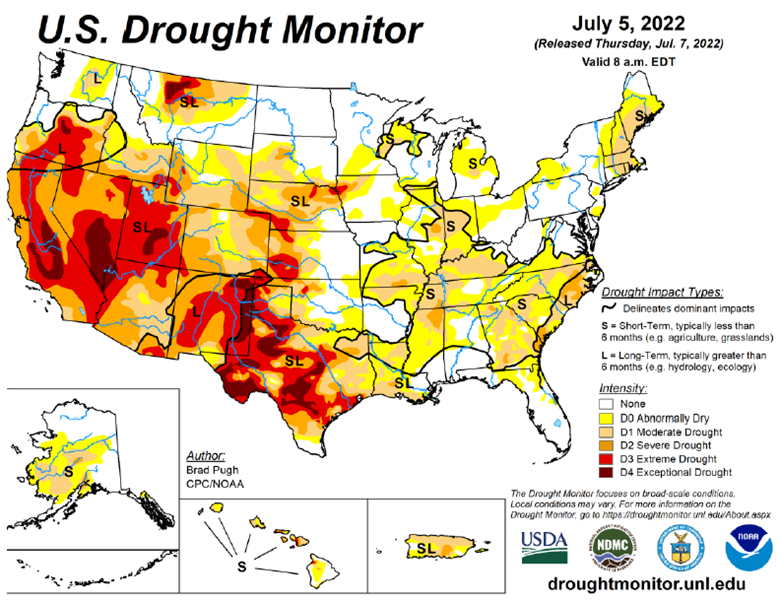
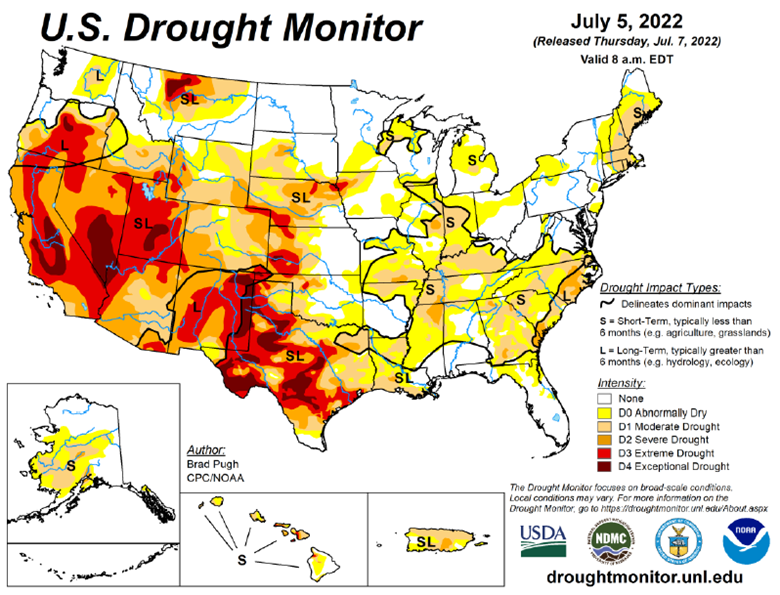
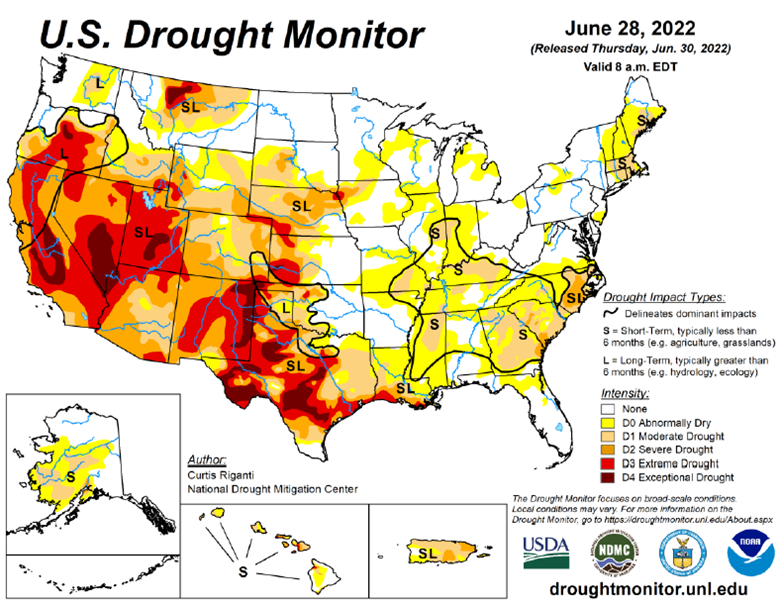
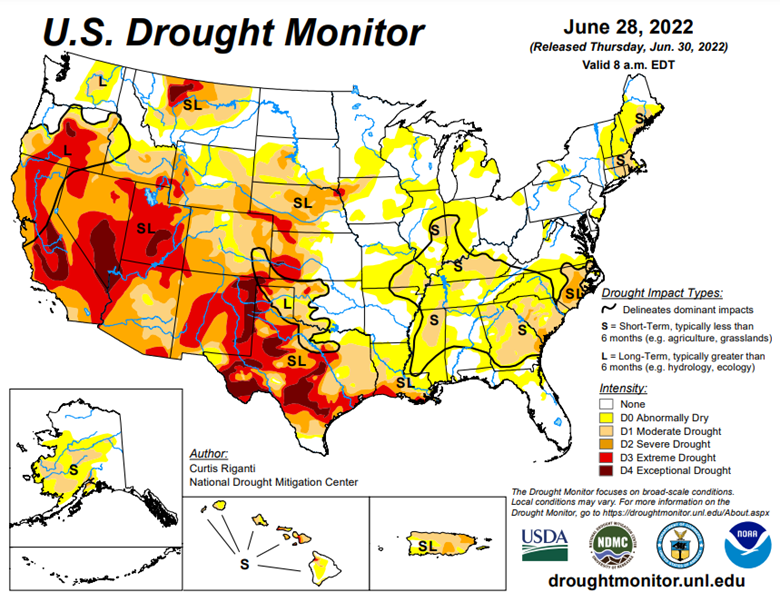
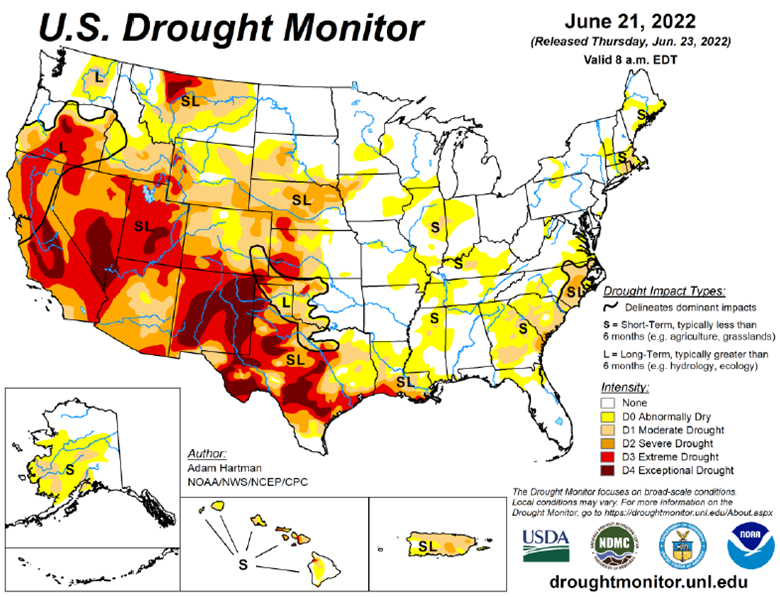
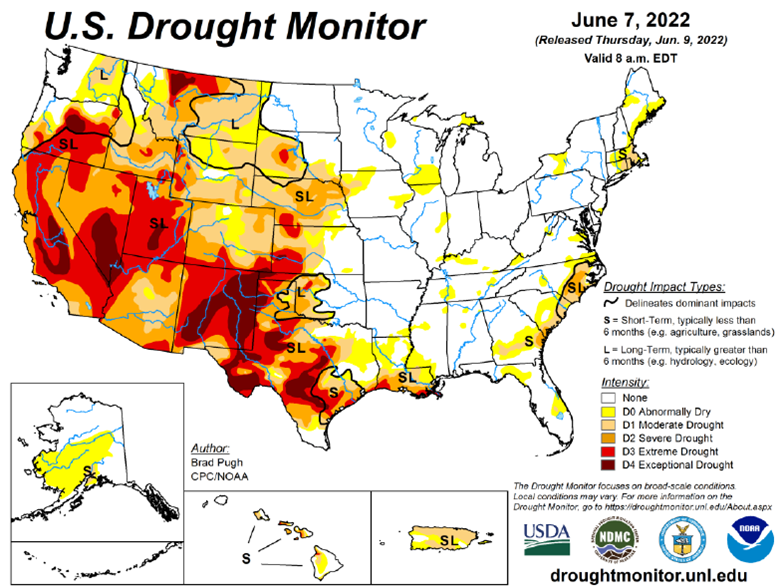
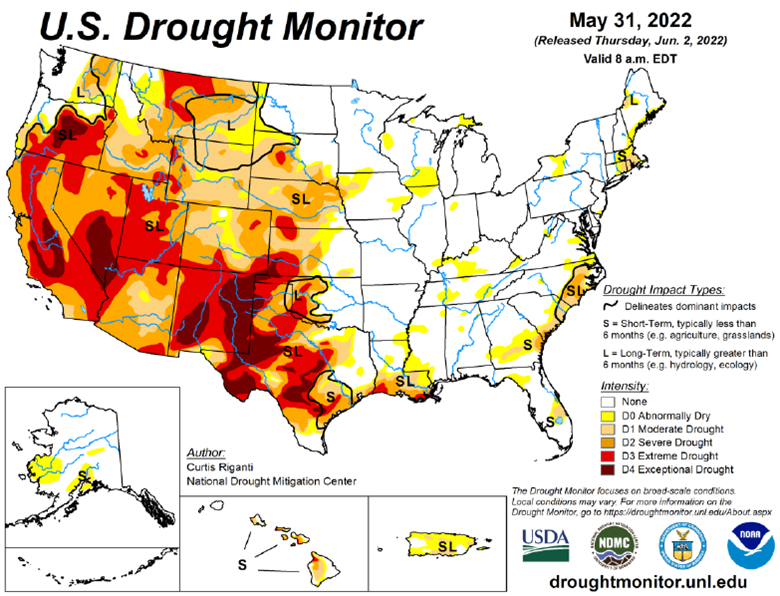
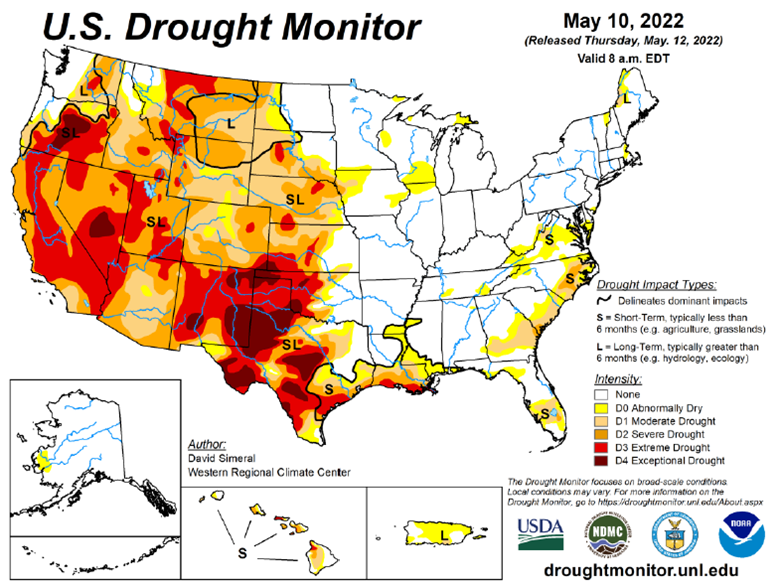
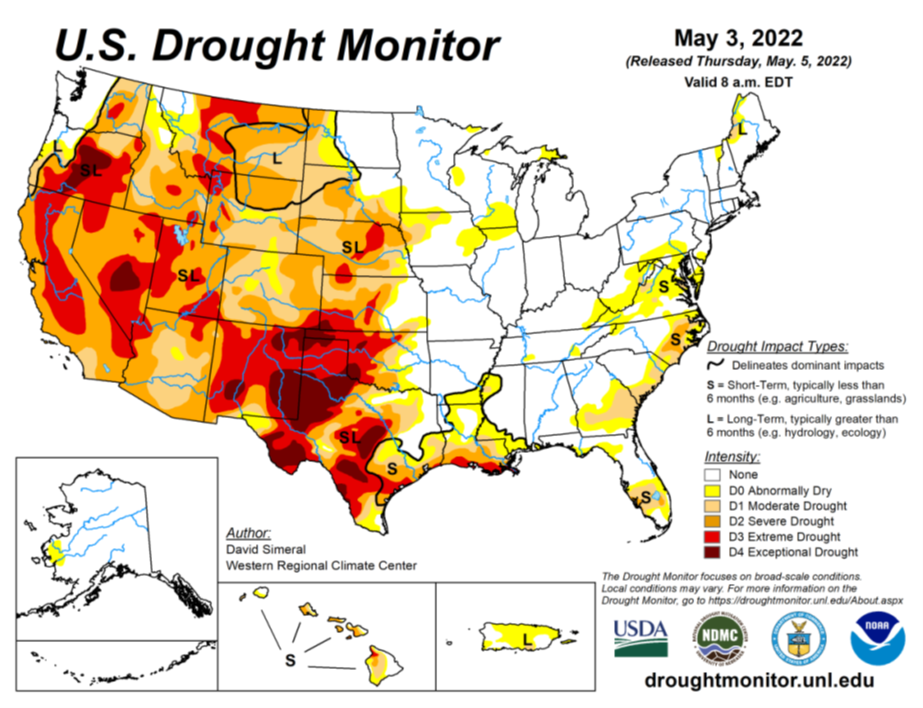
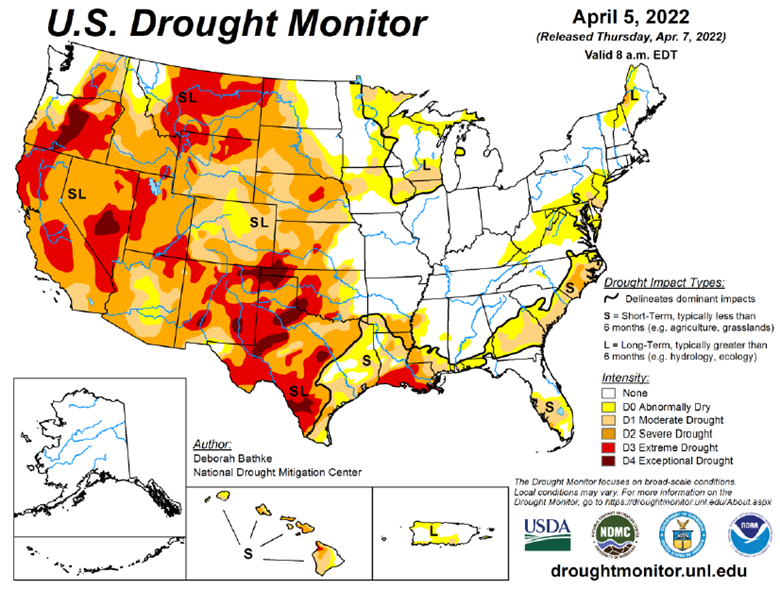
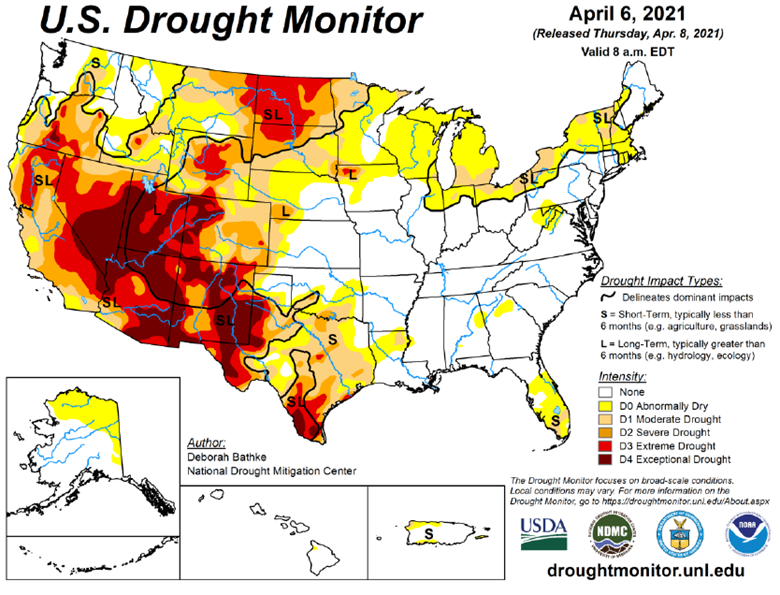
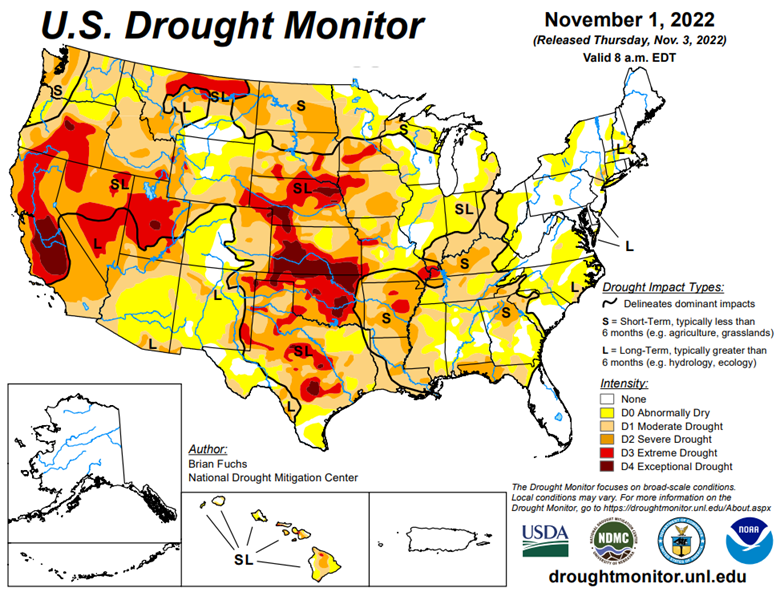
Drought Monitor
Podcast
Are the Fed’s hikes starting to dampen inflation? Oil, grains, and metals have all fallen from their highs. But the rarely spoken of Cotton market was one of the first to crack…falling from 1.58/lb to 0.95/lb in just a few short days. We’re digging into this sharp drop and just why and how Cotton is involved in seemingly everything with RCM’s very own cotton king, LOGIC advisors Ron Lawson.
In this episode, Ron is giving us the low down on how and why he believes it’s not Dr. Copper which acts as the global economic barometer, but how Cotton is the real Canary and leading indicator on global demand. In between those talks, we’re covering all things Cotton including crop insurance, irrigated vs dry land, the scam that was Pima and Egyptian Cotton, the process of cotton – which countries have it, which want it, ginning it, spinning it, dyeing it, global commodity merchant co’s pushing it around, and even micro-plastics, climate change, and how Cotton always flows to the cheapest labor source. Finally, we’re walking in some high Cotton putting Ron in the hot seat. Will we ever get the growth back? Tune in to get these critical hot takes — SEND IT!
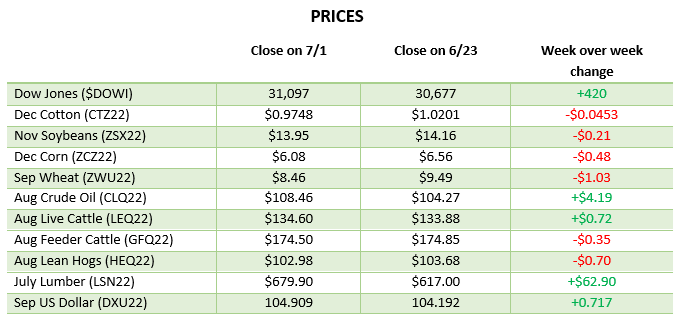
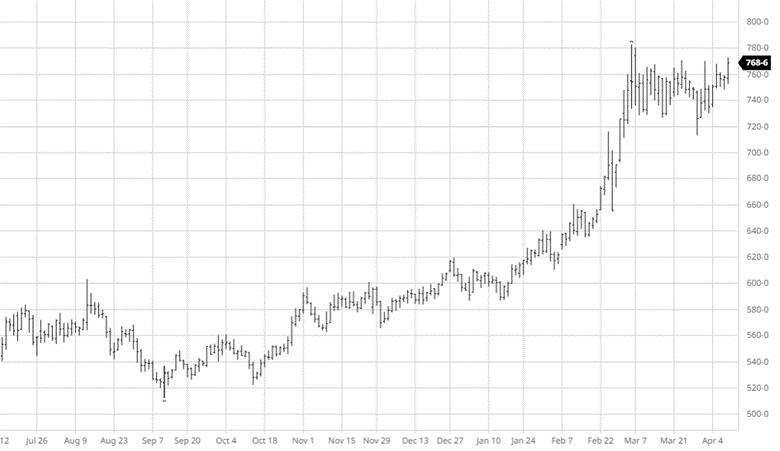
Via Barchart.com
Contact an Ag Specialist Today
Whether you’re a producer, end-user, commercial operator, RCM AG Services helps protect revenues and control costs through its suite of hedging tools and network of buyers/sellers — Contact Ag Specialist Brady Lawrence today at 312-858-4049 or blawrence@rcmam.com.