Tag: weekly prices

02 Nov 2026

LEONARD LUMBER REPORT: Seems like all the focus is on cutting supply

Seems like all the focus is on cutting supply. Is the supply risk real? Yes, the risk is real: current economic conditions in this industry could force closures. Yet, with all that risk, January futures still closed down $8.50 for the week. So, who is selling it down here?

First, it is industry longs who simply can’t take it anymore. Next are the commodity funds. Yes, they are rolling positions, but they are also adding. Remember, their design is to hold X amount of positions with Y dollars in the account. When the market moves in their direction, they add. They don’t have more information than the industry; they just trade more aggressively.

And when their position goes against them, they will pare it. Remember that.

By Friday, the futures market seemed to be dug in, especially in the November contract. Despite the drop in print, the trade is more reluctant to be short after the WF earnings and shutdowns. “Where there is one, there is normally more.” There wasn’t any activity on the cash side. It was all on the futures side and reflected the trade’s reluctance to be short.

The housing industry dances to its own tune. Outside influences might slow a trend, but they won’t stop it. The entire industry is backing off going into the end of the year. Between the elections, Iran and crude, rates, and the stock market, no one has a clear view of future demand. That’s why the focus is on supply. One thing my buddy Jay used to say is that when all the wood is sitting at the mills, prices go up. Let’s hope.


Daily Bulletin:

https://www.cmegroup.com/daily_bulletin/current/Section23_Lumber_Options.pdf

Southern Yellow Pine:

https://www.cmegroup.com/markets/agriculture/lumber-and-softs/southern-yellow-pine.volume.html

The Commitment of Traders:

https://www.cftc.gov/dea/futures/other_lf.htm


About the Leonard Report:

The Leonard Lumber Report is a column that focuses on the lumber futures market’s highs and lows and everything else in between. Our very own, Brian Leonard, risk analyst, will provide weekly commentary on the industry’s wood product sectors.


Brian Leonard

bleonard@rcmam.com

312-761-263

19 Oct 2026

LEONARD LUMBER REPORT: It was another miserable week in both futures and cash

Recap:

It was another miserable week in both futures and cash. The rallying cry for the fourth quarter is, “If we can only break even.” Hell of a way to run a business.

The proactive stance this year was to have inventory when things spiked. That strategy drastically cut into margins. The fact that product never got cheap enough to help navigate the trade is likely to continue through the rest of the year.

That same scenario does not appear on the futures side. Futures have fallen sharply and are starting to look at the 2025 lows as an objective. My guess is that we don’t get there, but it needs to be said for affect.

There really is no reason to spend much time on the demand equation when the 30-year mortgage continues to make new highs. Coming into the year, there was an argument that the affordability issue could ease with a 5% or 5.5% mortgage rate. That argument is gone now. The reality is that even builder buy-downs are doing little to stimulate interest.

There is a real disconnect. In 2025, we averaged 909,000 single-family starts. In August, single-family starts were running at a 918,000 annualized pace. The market is stable, and that takeaway is keeping cash prices higher than most want, but still lower than the mills can stand.

Futures, on the other hand, perceive more of the same. That kills any upward momentum. Thus the disconnect: cash prices are higher than expected while futures prices are lower than anyone wants.


Summary:

Look for the futures market to offer little, but what it does offer should be more upside movement than downside. Today, the 515 low and the 2025 low of 496 are just rounding errors in the macro picture.

We are in the camp that the producer side can exist under these conditions—and by conditions, I’m talking about another three quarters of losing money. The loans will run out, and reality will force many hands. That tension alone should slow any sharp selloff in futures.

At this point, there aren’t any basis or forward opportunities, only risk management. If you own wood, hedge a percentage on any spike. It doesn’t matter if you’re hedging a loss. You are buying time.


Daily Bulletin:

https://www.cmegroup.com/daily_bulletin/current/Section23_Lumber_Options.pdf

Southern Yellow Pine:

https://www.cmegroup.com/markets/agriculture/lumber-and-softs/southern-yellow-pine.volume.html

The Commitment of Traders:

https://www.cftc.gov/dea/futures/other_lf.htm


About the Leonard Report:

The Leonard Lumber Report is a column that focuses on the lumber futures market’s highs and lows and everything else in between. Our very own, Brian Leonard, risk analyst, will provide weekly commentary on the industry’s wood product sectors.


Brian Leonard

bleonard@rcmam.com

312-761-263

12 Oct 2026

LEONARD LUMBER REPORT: Open interest in the short fund category jumped 396 last week

The Market:

I have to lead with this fun fact. The Sept-Nov roll traded as high as +22.40. It started around -20 in early August and spent all of September positive.

Open interest in the short fund category jumped 396 last week. At 6,605, that is the most we have seen in months. The roll starts next week and will probably continue right up to expiration.

If you paid -17 and it only gets to -7, you pick up $10. When was the last time you made $10 on a car of cash? I’m just saying……

The focus is on the 10% reduction and the roll. Most likely, neither will have much effect on cash or futures. Put those to rest and move on.

Friday was a short-covering day on light volume. Nothing more and nothing less. That said, when you move that sharply there is always a chance for some nervousness and follow-through.

The technical read has a few positives now. On a weekly basis, closes through 546.70 and 552.00 would actually add some momentum to the buy side. With the stochastics nearing a positive cross, there is some upside room, but those levels need to be crossed first.

On the daily, the read is more positive in real time. The stochastics have crossed to the positive. We also saw the industry adding longs as the market broke.

A bottom is trying to form.

I’ll end with this. On Thursday, November futures hit $515, or roughly $393/mill. That is not sustainable. The industry stepping up to buy confirms the thought process, but when it is only the computer trading, the computer wins.

 
For those interested: The Bears losing to the Packers the week Ditka passed away tells me the current coach shouldn’t relocate the family to Chicago just yet….

Daily Bulletin:

https://www.cmegroup.com/daily_bulletin/current/Section23_Lumber_Options.pdf

Southern Yellow Pine:

https://www.cmegroup.com/markets/agriculture/lumber-and-softs/southern-yellow-pine.volume.html

The Commitment of Traders:

https://www.cftc.gov/dea/futures/other_lf.htm


About the Leonard Report:

The Leonard Lumber Report is a column that focuses on the lumber futures market’s highs and lows and everything else in between. Our very own, Brian Leonard, risk analyst, will provide weekly commentary on the industry’s wood product sectors.


Brian Leonard

bleonard@rcmam.com

312-761-263

09 Oct 2026

AG MARKET UPDATE: SEPTEMBER 15 – OCTOBER 9

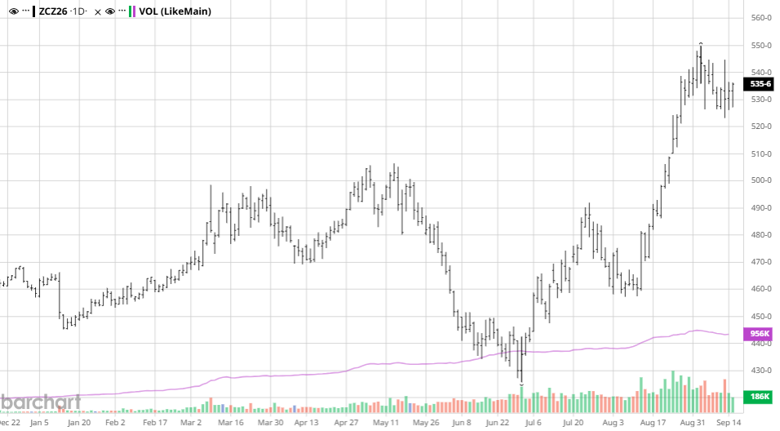
Corn came into the report already on the defensive. After running to the $5.30 area in mid-September on Black Sea export disruptions and USDA’s September yield cut to 178.5 bu/ac, December futures broke hard on September 30th when the quarterly Grain Stocks report found 2.095 billion bushels of old-crop corn on hand, 173 million more than USDA had been carrying and roughly 35% above a year ago. December corn lost 21 cents that day and has spent the last week defending the $5.00 level, with a U.S. dollar sitting near a 1.5-year high adding to the pressure. The one supportive factor has been the weather: El Niño-driven rains made September the wettest on record in Lincoln and the second wettest in Des Moines, leaving corn harvest just 23% complete on October 4th, four points behind average, with only 54% of the crop rated good to excellent.

Today’s Crop Production report went the opposite direction of what the market was positioned for. USDA raised the national yield 2.7 bu/ac to 181.2, well above the 177.7 trade average and near the top of the range, lifting production to 16.03 billion bushels, the second-largest crop on record. Record state yields were forecast in Iowa, Ohio, Kentucky, Tennessee, Mississippi and Arkansas. That pushed 2026/27 ending stocks to 1.849 billion bushels, versus 1.670 expected and 1.567 in September. Corn tumbled as much as 30 cents after the release. Many in the trade will question a yield increase in a crop with poor ratings and a slow, wet harvest, and combine results over the next few weeks will either confirm or chip away at this number ahead of the November report.

Via Barchart

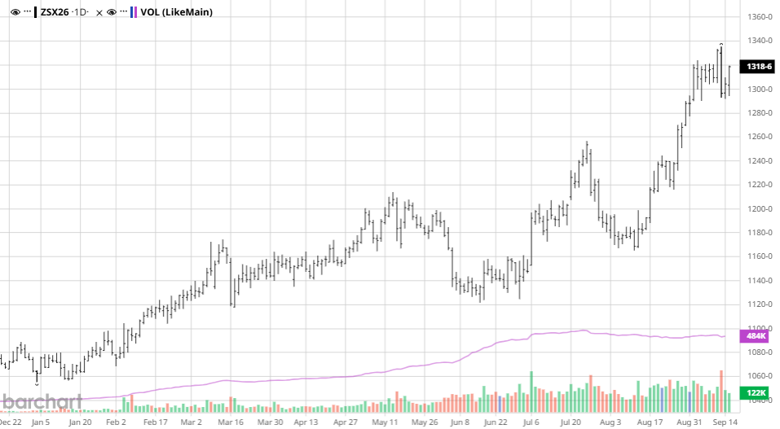
Soybeans held up far better than corn. USDA raised the yield 0.3 bu/ac to a record 53.1, putting production at a record 4.56 billion bushels, with 2026/27 ending stocks at 315 million bushels, 5 million above September and 10 million above the trade guess. That is mildly bearish, but the balance sheet remains far tighter than corn. Since the last update, the Trump-Xi summit in Washington September 24th-25th extended the U.S.-China trade truce to January 10, 2027, and China has now booked roughly half of its 25 MMT annual purchase commitment. November beans slipped to a four-week low near $12.78 after the summit as the market sold the news, then recovered back above $13 on harvest delays and quality concerns, with harvest only 25% complete as of October 4th, eight points behind average. Export commitments are running nearly double last year’s pace, and record-large crush demand remains the backbone of the complex. Over the next two weeks, watch the mid-October NOPA crush report, the pace of Chinese flash sales, and early Brazilian planting conditions as El Niño develops.

Via Barchart

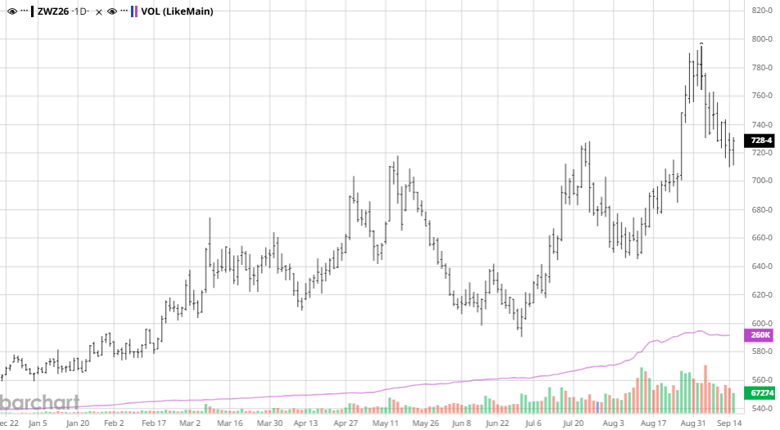
Wheat had a rough September, with Kansas City futures falling more than $1 per bushel as Black Sea grain flows showed marginal improvement and ceasefire talks gained traction. Those talks have since stalled, and wheat appears to have found a short-term bottom near its early-August lows, with December SRW around $6.83 and December KC HRW around $7.36 heading into the report. USDA raised 2026/27 U.S. ending stocks 23 million bushels to 740 million, above the 721 million trade guess, reflecting the larger 1.534 billion bushel crop from last week’s Small Grains Summary and weak export demand. First-quarter shipments were the second lowest in 50 years and the strong dollar is not helping U.S. competitiveness. World stocks were trimmed slightly to 276 MMT, but those numbers are distorted by grain building up behind the closed Black Sea ports. Winter wheat planting was only 27% complete on September 27th, seven points behind average, and emergence in the Plains will be worth watching.

Via Barchart

Equity Markets

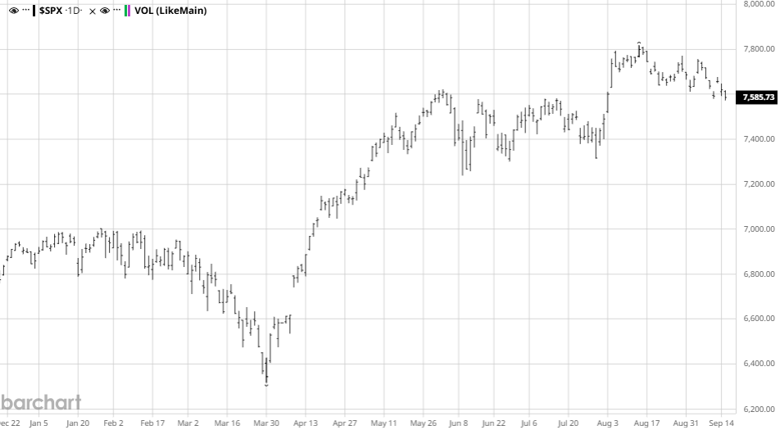
Equity markets have been range-bound since August, with the S&P 500 trading roughly between 7,620 and 7,800 and testing record highs, though breadth has been thin with fewer stocks participating in the move. Oil back above $90 has kept inflation front and center, and the bond market is increasingly pricing in the possibility of a Fed rate hike rather than a cut. September CPI on October 14th and the October 27th-28th FOMC meeting are the key events ahead. The Mag 7 stocks have helped keep the markets at highs while most stocks are struggling and well below their 52 week highs except in some areas.

Via Barchart

Energy Markets

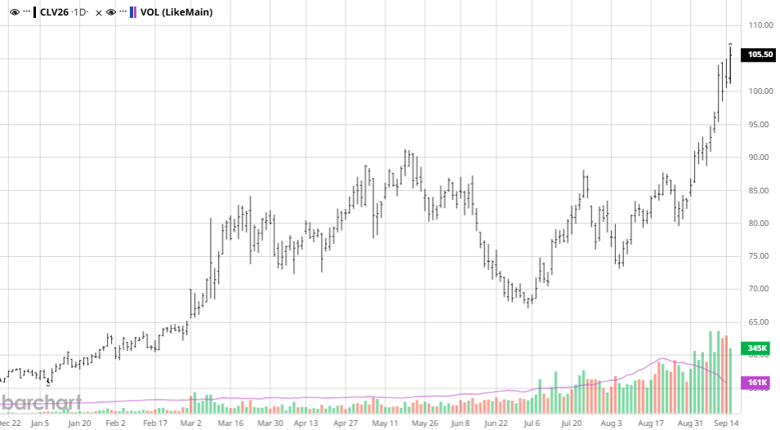
Crude oil has moved sharply higher again as Iranian attacks on tankers in the Strait of Hormuz have been more frequent this month than at any point since the war began in late February. Brent pushed back above $100 on Thursday and WTI traded above $92, with Hurricane Isaias also shutting about a quarter of Gulf of Mexico oil production. Oil eased Friday morning after President Trump cited productive discussions with Iran, and a deal with Russia to release barrels in exchanged for pausing sanctions but the headline risk remains two-sided.

Via Barchart

Other News

– Cotton production was raised to 13.44 million bales, well above the 12.97 million trade guess, with 2026/27 U.S. ending stocks at 3.80 million bales versus 3.46 expected. That is a bearish surprise for a market that had been holding near 80 cents in December futures. Producers with unpriced bales should be weighing downside protection while keeping some upside participation.

– Sovecon cut its forecast for Russian 2026/27 grain exports to 44.7 MMT from 49.4 MMT and warned that Azov and Black Sea ports may remain shut into 2027, keeping a structural question mark over world wheat and corn supplies.

– Key dates ahead: weekly Crop Progress reports every Monday, September CPI on October 14th, NOPA crush in mid-October, the FOMC meeting October 27th-28th, and the November WASDE.

Drought Monitor

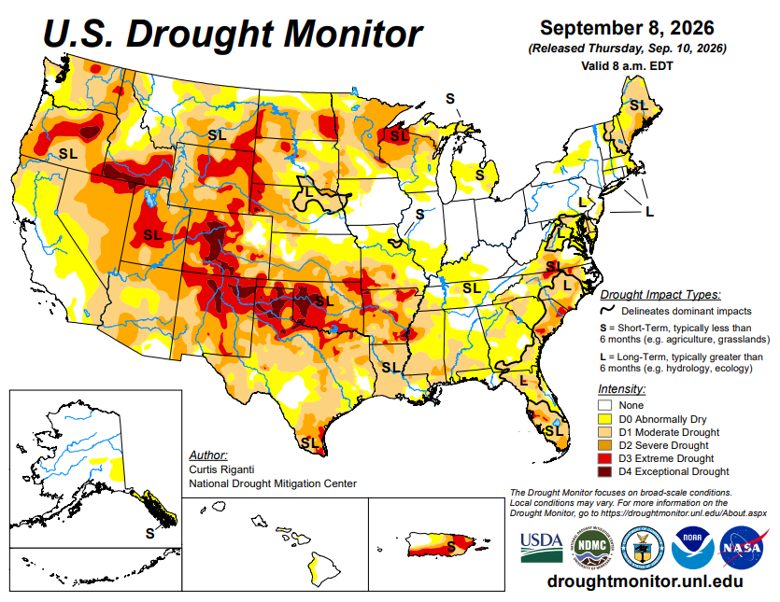
Here is the most recent drought monitor with harvest rolling.


Contact an Ag Specialist Today

Whether you’re a producer, end-user, commercial operator, RCM AG Services helps protect revenues and control costs through its suite of hedging tools and network of buyers/sellers — Contact Ag Specialist Brady Lawrence today at 312-858-4049 or blawrence@rcmam.com.



05 Oct 2026

LEONARD LUMBER REPORT: November futures fell $11.50 for the week on low volume

Recap:

November futures fell $11.50 for the week on low volume. The commitment of traders report shows a gain in both the commercial longs and in the commodity fund shorts. Total open interest for the week was up 700 to 10,546. The additional 300 after the Tuesday report will be added to both piles. It indicates that both are committed to their positions. That’s important.


Macro:

Having a long position anywhere in this industry is difficult when rates are making new highs. The longs are locking in lower pricing—a very micro strategy in a market being driven by macro forces. At the same time, the funds are piling into a winning short position as the macro data continues to gain momentum in this commodity. It really is that simple.

So let’s talk about rates.

The 30-year fixed mortgage averaged 7.28% for the week ending October 1, up from 7.03% the week before. That is a meaningful move for housing, especially with so many existing homeowners still locked into cheap mortgages. Through Q2, 49.1% of outstanding mortgages were below 4% and 65.6% were below 5%. Why move???

The part that continues to be ignored is that a 7% mortgage rate is not historically abnormal. The abnormal period was 0% short-term interest rates turning into 3% mortgages. That was not a healthy economic equilibrium; it distorted the global rate market, flooded the system with cheap capital and changed the way consumers think about the cost of money.

The problem today is not simply that mortgage rates are 7%. It is how the marketplace repairs the damage created by years of near-zero rates. Calling for a return to ultra-low rates misses the point. The market has to learn how to function at a higher nominal rate, and that adjustment takes time.

We are still digesting an enormous amount of capital that was pushed into the system. Until that liquidity works its way through, housing has to adjust through time, income growth, home prices and eventually rates. Rates are only one part of the repair.

That creates two problems for lumber. First, affordability gets worse for the marginal new-home buyer. Second, existing homeowners have even less incentive to sell and move. Neither dynamic creates urgency for the lumber buyer. Builders can lock in attractive wood prices, but cheap wood does not offset an expensive mortgage.

More importantly, even a drop in mortgage rates to 5.5% may produce only a marginal bump if home prices and monthly payments still do not create value. The sector cannot simply be bought off with cheaper money again. Real value has to rebuild.

That brings us to the simplest question in housing: is paying 7% on a large mortgage a better economic decision than renting? For many buyers today, the answer is no. Until that equation begins to change, lower rates alone are unlikely to unleash the demand the lumber market keeps waiting for.

This is where the micro and macro stories separate. On the micro side, lumber prices can look inexpensive, mills can curtail production, and a buyer can justify owning futures against future needs. On the macro side, rates are telling the industry to remain defensive. Until that changes, the funds have little reason to abandon a short position that continues to work.

And that leaves lumber with a familiar solution. If demand cannot be stimulated enough to move prices higher, supply has to come down to meet demand. Once again, the burden shifts back to production cuts and mill discipline.


Here we go again…..


Daily Bulletin:

https://www.cmegroup.com/daily_bulletin/current/Section23_Lumber_Options.pdf

Southern Yellow Pine:

https://www.cmegroup.com/markets/agriculture/lumber-and-softs/southern-yellow-pine.volume.html

The Commitment of Traders:

https://www.cftc.gov/dea/futures/other_lf.htm


About the Leonard Report:

The Leonard Lumber Report is a column that focuses on the lumber futures market’s highs and lows and everything else in between. Our very own, Brian Leonard, risk analyst, will provide weekly commentary on the industry’s wood product sectors.


Brian Leonard

bleonard@rcmam.com

312-761-263

21 Sep 2026

LEONARD LUMBER REPORT: The one feature of the week was computer-like selling

Week Recap:

The November futures fell $33 on light volume. The one feature of the week was computer-like selling in most sessions after expiration. What became apparent was that the pre-expiration rally was liquidation-driven. Once that was complete, the downward trend continued. Open interest fell by about 800 contracts. November futures are now down $120 in 43 sessions.


Market make up:

The producer side has 5,305 longs in place and 439 shorts. Yes, the industry is not short. The funds are short 6,066 contracts. We see a limit to how many shorts they are willing to carry, so much of the selling late in the week was most likely algorithmic in nature. We are also seeing a marked pickup in swap trades for this contract.

I would note that open interest remains high despite the lack of trade. There is no discount and no premium. Today, the only thing being offered is cheap and cheaper. There will be a rather large roll. The question is where it starts from.


Funds:

The funds remain very difficult to track. We know that interest rates, the dollar, and other economic factors all play into the equation. What we do not know is how they are positioned in other commodities, nor do we know their true capacity. The futures market rallied to $660 because they were exiting positions and fell to $536 on Friday because they continued to add shorts.

In trading-floor lingo, we blew them out, and now they are back with a vengeance.


Summary:

The discussion around the funds has little to do with why November futures settled at $537. The market settled at new lows because the housing market is sputtering just as mills are ramping production back up following summer shutdowns. Over the last few years, demand has remained relatively consistent. I believe the healthy premium in the futures market encouraged buyers to step up more aggressively than necessary. Today, that advantage is gone, leaving buyers strictly hand-to-mouth. Add a modest increase in post-shutdown supply, and the result is an imbalance. There is little appetite for risk in this environment. The trade will buy when it needs wood, and it does not matter if they have to pay up. At this point you have to create value in the futures market by going to a premium or discount. That could take time. 


Daily Bulletin:

https://www.cmegroup.com/daily_bulletin/current/Section23_Lumber_Options.pdf

Southern Yellow Pine:

https://www.cmegroup.com/markets/agriculture/lumber-and-softs/southern-yellow-pine.volume.html

The Commitment of Traders:

https://www.cftc.gov/dea/futures/other_lf.htm


About the Leonard Report:

The Leonard Lumber Report is a column that focuses on the lumber futures market’s highs and lows and everything else in between. Our very own, Brian Leonard, risk analyst, will provide weekly commentary on the industry’s wood product sectors.


Brian Leonard

bleonard@rcmam.com

312-761-263

15 Sep 2026

AG MARKET UPDATE: AUGUST 31 – SEPTEMBER 15

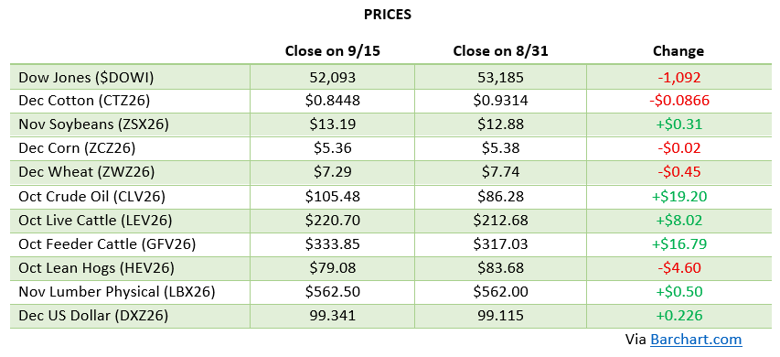
Corn spent the two weeks since August 31st grinding higher into last Friday’s USDA September Crop Production and WASDE report, with December futures pushing up toward the $5.30 area as the market priced in a tightening balance sheet. The report delivered on that theme without shocking anyone: USDA trimmed the 2026 national yield to 178.5 bushels per acre, essentially in line with pre-report estimates, while total production came in at 15.800 billion bushels. The bigger story was on the stocks side: 25/26 ending stocks were revised down to 1.922 billion bushels and the 26/27 figure came in at 1.567 billion bushels, keeping the stocks-to-use ratio tight enough that some analysts are now targeting the $5.80-$6.00 range on the board. Corn traded 1 to 2 cents lower in the immediate reaction, but the chart still looks constructive with a choppy, higher pattern intact. A modest reduction to harvested acres reflects some early silage cutting in the western Corn Belt trimming the acreage base, and with the new marketing year underway since September 1st, attention now turns to how much of this story gets revised when harvested-acreage data arrives in the October report.

Via Barchart

Soybeans have been the standout of the row-crop complex, setting a new contract high on November futures in overnight trade ahead of Friday’s report before giving back a chunk of those gains into the close. Chinese demand has been the driver, buyers picked up another 136,000 tons ahead of Friday’s open, pushing the running total over the prior three sessions above 700,000 tons, all under the 2026/27 marketing year, with a formal purchase window reportedly set to open September 24th that should keep the buying headlines coming. The WASDE itself held few surprises: USDA nudged the 2026 yield up to 52.8 bushels per acre, raised production to 4.535 billion bushels, and, the one real surprise in the report, added roughly 12 million bushels to the 26/27 ending stocks estimate, bringing it to 310 million bushels. Beans traded 25 to 30 cents lower on the day as funds booked profits after the recent run, and the chart looks tired and toppy in the short term, though with China back in the market a break much below $13 on November futures would be a surprise.

Via Barchart

Wheat has been the laggard of the three since the last update, sliding into Friday’s report and losing another 13 to 15 cents on the day. The WASDE showed U.S. 2026/27 wheat stocks essentially steady at 717 million bushels, but a surprise increase of roughly 100 million bushels to the world stocks figure, now projected near 276.3 million metric tons, added pressure, compounded by unconfirmed chatter around progress in Black Sea negotiations. Ukrainian export logistics remain a persistent drag on the world balance sheet as well. With the domestic supply story unchanged and global stocks trending the wrong direction, wheat will likely need a fresh weather or geopolitical catalyst to turn the recent slide around.

Via Barchart

Equity Markets

Equity markets have been choppy and headline-driven since the end of August. Stocks sold off sharply into month-end and again to start September, then whipsawed on the August jobs report, nonfarm payrolls came in at 162,000 versus the roughly 53,000 economists expected, reigniting debate over whether the Fed’s next move is a cut or a hike given the current 3.50%-3.75% target range. That debate has only intensified as crude oil has surged on renewed U.S.-Iran hostilities in the Strait of Hormuz, adding a fresh layer of inflation concern heading into the Fed’s September 15-16 meeting, the next major catalyst for the broader market. The market has priced in over a 90% chance of a 1/4 point hike this week.

Via Barchart

Energy Markets

Energy markets took a sharp turn over the past week as the fragile calm around the Strait of Hormuz broke down. The U.S. and Iran exchanged direct strikes on shipping and naval assets, and strikes shutdown a major pipeline in Saudi Arabia, causing Brent crude to jumped back above $100 per barrel, with WTI trading near contract highs. Traffic through the Strait has reportedly collapsed to a small fraction of normal levels, and with several banks warning that disruptions could persist well into 2027, the renewed energy premium is worth watching closely for its knock-on effects on fertilizer and freight costs heading into fall applications and harvest.

Via Barchart

Other News

– The new 2026/27 marketing year for corn, soybeans, and sorghum began September 1st; July soybean crush came in at 222 million bushels, up 4 million from June and 17 million from a year ago.

– China’s formal purchase window for new-crop soybeans is reportedly set to open September 24th: a date worth watching for confirmation of the recent pace of buying.

– Ukrainian wheat export logistics remain constrained, continuing to weigh on the world wheat balance sheet.

– The October Crop Production report will be the first to incorporate harvested-acreage data and is expected to be a significant mover for corn given the recent yield trend.

Drought Monitor

Here is the most recent drought monitor.

Contact an Ag Specialist Today

Whether you’re a producer, end-user, commercial operator, RCM AG Services helps protect revenues and control costs through its suite of hedging tools and network of buyers/sellers — Contact Ag Specialist Brady Lawrence today at 312-858-4049 or blawrence@rcmam.com.



08 Sep 2026

LEONARD LUMBER REPORT: THE CHALLENGE IS TO NOT SEEM TO BE HOLDING A POSITIVE TONE WHEN NO DATA SUPPORTS IT

The challenge for me is to not seem to be holding a positive tone when no data supports it. But here goes.

We came into last week with weak cash reports, which continued on Monday. By Wednesday, those few transactions had disappeared, and some mills were actually reporting better days. Items like 9′ tightened up.

So, while this is far from a roaring commitment to getting long, it does suggest there is a fight to find a bottom.

Today’s strategies and cycles are not very sophisticated. Run inventories down to the dirt and be forced to buy something. Buy when inventories get low, then sell into the rally. That is how many companies profit today. There is no glamour and very little margin in it.

At the moment, inventories are not at panic levels, so the trade is only cautiously looking at the market. The focus now shifts to the September expiration and whether there will be a debacle or not.

This is a difficult time of year to get bearish. The next round, which could also be the last meaningful move of the year, starts to define itself in early September. The trade has time to wait it out, and it likely will. I just do not see that process lasting through the traditional seasonal lows in October. It is simply not that bad out there.

The funds added another 1,000 contracts during the latest reporting period. At roughly 6,300 shorts, it appears they are once again fully invested. Open interest was stagnant to lower throughout the week, suggesting they were not adding to positions.

If that is the case, future selling pressure will likely have to come from a weakening cash market rather than another wave of fund activity. What the 6,300 figure also tells us is that the spread trade is alive and well again.

If the market reaches early October with a high level of indifference, there is at least a case to be made that a soft long bias could emerge from the roll. For now, that remains a possibility rather than a forecast, but it is something worth watching as expiration approaches.


Technical:

The technical picture is becoming well defined. The November contract appears to be building a bottom between 548.00 and 573.50. A break below 548.00 would be very destructive and would likely force a reassessment of the broader outlook. The upper trading range sits between 573.50 and 589.25. Those levels define the current trading boundaries. With the stochastics turning positive, it would take a considerable amount of selling pressure to drive the market through 548.00. By comparison, it would not take much to push futures through 589.25. A round of short covering alone could accomplish that.

Again, I am not trying to sound positive. But after a $100 correction and with much of the trade firmly in the “going to zero” camp, futures may finally be in a position to put up a fight.


Daily Bulletin:

https://www.cmegroup.com/daily_bulletin/current/Section23_Lumber_Options.pdf

Southern Yellow Pine:

https://www.cmegroup.com/markets/agriculture/lumber-and-softs/southern-yellow-pine.volume.html

The Commitment of Traders:

https://www.cftc.gov/dea/futures/other_lf.htm


About the Leonard Report:

The Leonard Lumber Report is a column that focuses on the lumber futures market’s highs and lows and everything else in between. Our very own, Brian Leonard, risk analyst, will provide weekly commentary on the industry’s wood product sectors.


Brian Leonard

bleonard@rcmam.com

312-761-263

01 Sep 2026

LEONARD LUMBER REPORT: It was another brutal week for prices

Recap:

It was another brutal week for prices as both cash and futures continued to unwind. On Wednesday and Thursday, we saw a pickup in selling from the funds into the November contract. That is not typical. Short funds do roll to the second month, but they normally do not add to positions before the front-month expiration.

So, what has changed? Most likely, the funds have started to rebuild from an extremely low position back toward full exposure. Total open interest climbed from 6,000 to 10,300 in a matter of weeks. This has been an extreme reversal and raises the open question of just how short they want to be. Is the target 6,000 shorts, 8,000 shorts, or even more?

So why all the discussion about the risk coming from a non-industry factor? Because the funds are driving the market. Price does not. Supply does not. The funds do. Over the long run, price, the economy, and supply and demand will take the lead. But when positions are being built or liquidated, those flows become the primary drivers.

For the industry, the timing is nearly impossible, but the data carries a great deal of weight. Many have bought futures and cash at levels that should prove profitable during this selloff, yet they are now showing up as done far too early. Did they maximize profits? No. But no one can factor fund momentum into otherwise sound market analysis. It only becomes visible in hindsight, when you discover you were either too early or too late.

This week, the cost of production and mounting mill losses will once again work its way into the conversation. While it may seem like a micro issue, it is a market driver across all commodities. Ultimately, it will force the market to find a trading level while the industry attempts to rebalance once again.

The timeline is relatively straightforward. The market will first determine whether the funds are moving from 6,000 shorts toward 8,000. At this point, there is little reason to expect them to pause. If they continue to build positions aggressively, futures could test the $500 level. If the pace of selling begins to slow, futures should work back toward the $580–$600 trading range, which has served as the market’s median value area for years.


Technical:

The futures market is extremely oversold. Probably much more than the data shows. November corrected Friday to 19.3% or a 2 to 1 rate of change. I don’t want to get into the weeds on this one because there is more undue pressure added to the futures side. Oscillators don’t cover this very well. The market has been sitting oversold all of August. The next push lower could create a sharp upward correction. Until then, messy is the best way to sum it up.


Daily Bulletin:

https://www.cmegroup.com/daily_bulletin/current/Section23_Lumber_Options.pdf

Southern Yellow Pine:

https://www.cmegroup.com/markets/agriculture/lumber-and-softs/southern-yellow-pine.volume.html

The Commitment of Traders:

https://www.cftc.gov/dea/futures/other_lf.htm


About the Leonard Report:

The Leonard Lumber Report is a column that focuses on the lumber futures market’s highs and lows and everything else in between. Our very own, Brian Leonard, risk analyst, will provide weekly commentary on the industry’s wood product sectors.


Brian Leonard

bleonard@rcmam.com

312-761-263

31 Aug 2026

AG MARKET UPDATE: AUGUST 12 – 31

Corn has been the story of the grain complex since the August 12th WASDE, and it hasn’t been a quiet one. December corn has rallied roughly 70 cents since that report, punching through $5 for the first time since 2023 and touching contract highs. The August WASDE itself was modestly bullish, with NASS leaning more heavily on satellite and administrative data alongside its survey, trimming new-crop ending stocks to 1.653 billion bushels even as harvested acres were raised. The real fuel for the rally came a week later, when the Pro Farmer Crop Tour pegged the national corn yield at just 173.2 bushels per acre, well below the USDA’s 180.7 figure and about 10 bushels off trend. Funds piled in behind the number, pushing managed money’s net long position to its largest since April 2022, with outright long positions close to record. Weekly crop condition ratings have backed up the tour’s findings, with the good-to-excellent rating slipping to 57% as of August 23rd, while ratings go down the closer we get to harvest at these levels a record crop seems highly unlikely. Export demand has stayed a bright spot through all of this, with cumulative shipments running 26% ahead of last year’s pace and a steady stream of flash sales to Mexico. The market has room to run further if the September 11th WASDE confirms a lower yield, but the size of the current fund position also leaves it vulnerable to a sharp give-back if weather turns more favorable into fill or funds start booking profits. If you haven’t looked at pricing some new crop bushels at these levels, now is a good time to have that conversation with your merchandiser.

Via Barchart

Soybeans have been the quieter half of the row-crop rally, caught between a bearish crop tour number and relentless Chinese demand. The August WASDE actually raised the national yield estimate to 53 bushels per acre and left ending stocks at a comfortable 320 million bushels, but the Pro Farmer Crop Tour turned more cautious on beans, projecting a crop of 4.572 billion bushels on a 53.3 bushel yield, a number the trade read as modestly bearish relative to corn’s tightening story. What has kept beans supported is demand: China has been buying almost daily since mid-August, with a single week’s net sales reaching 2.48 million metric tons, up 44% from the week before, as Beijing works toward the 25-million-metric-ton annual purchase commitment struck at May’s Trump-Xi summit in Beijing. A follow-up meeting between the two leaders is anticipated in September and remains a watch item for a fresh round of buying. Crush margins have stayed historically strong and continue to underpin the nearby contracts even as the funds have leaned more heavily into corn. With China’s buying pace this consistent, beans have a demand story that’s hard to ignore even if the yield picture isn’t as bullish as corn’s.

Via Barchart

Wheat has been the biggest percentage mover in the complex, and the Black Sea is once again the reason why. Ukraine struck Russian export terminals at Novorossiysk with drones on August 12th, and the disruption has lingered, with SovEcon projecting Russian wheat exports for the month at just 3-3.4 million tonnes, well below the five-year August average of 5 million. Reports late in the period that Russia-Ukraine peace talks have hit a dead end, with Russia said to be preparing to escalate attacks, have kept a fresh war premium in the market. Domestically, the spring wheat crop has taken on its own stress story, with USDA estimating 80% of spring wheat acres in drought as of August 25th, up sharply from just 13% a year ago. Chicago SRW and Kansas City HRW have both pushed to fresh multi-week highs as a result, with September SRW trading near $6.82 and HRW above $7.50 late in the period. For now, wheat is trading headlines out of the Black Sea as much as it’s trading fundamentals, so any real progress toward a ceasefire could pull the premium back out just as quickly as it came in.

Via Barchart

Equity Markets

Equity markets have had a choppier stretch since the S&P 500 notched a fresh record close above 7,800 in mid-August on cooler-than-expected CPI and PPI data. Since then, renewed direct exchanges between the U.S. and Iran, including strikes on Iranian positions on Larak Island over the weekend and reported Iranian retaliation against a U.S. base in Jordan, have kept traders on edge, and the S&P 500 has spent the back half of the period essentially treading water within half a percent of its levels from three weeks ago. Rising long-end bond yields have added to the uncertainty, with the 30-year Treasury yield touching a 19-year high. The AI trade has remained the market’s ballast through the volatility, with strong earnings from names tied to artificial intelligence infrastructure and cybersecurity continuing to draw buyers even as more macro-sensitive and consumer names have been hit hard on disappointing results.

Via Barchart

Energy Markets

Crude oil has been the swing factor behind a lot of the volatility across both stocks and grains this period. Prices pushed toward $85 per barrel in mid-August as the Trump administration signaled it was in no rush to resolve the standoff with Iran, then reversed sharply, falling more than 5% over the following week as the U.S. pivoted toward a sanctions-based pressure campaign rather than further military action. That calm didn’t last, as fresh U.S. strikes on Iranian targets late in the period reignited the geopolitical premium.

Via Barchart

Other News

– The Pro Farmer Crop Tour wrapped up the week of August 17th, pegging the national corn crop at 15.344 billion bushels on a 173.2 bushel yield and the soybean crop at 4.572 billion bushels on a 53.3 bushel yield.

– Cotton has ridden the broader commodity rally to contract highs, with December cotton settling at a contract-high close late in the period as chart-based buying accelerated alongside the grain complex.

– The next USDA WASDE report is scheduled for September 11th.

Drought Monitor

Here is the most recent drought monitor.

Contact an Ag Specialist Today

Whether you’re a producer, end-user, commercial operator, RCM AG Services helps protect revenues and control costs through its suite of hedging tools and network of buyers/sellers — Contact Ag Specialist Brady Lawrence today at 312-858-4049 or blawrence@rcmam.com.