
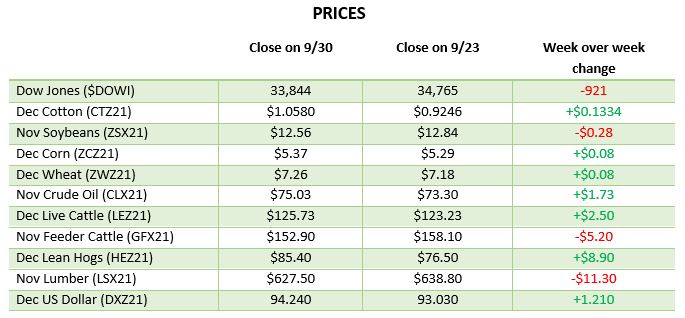
AG MARKET UPDATE: SEPTEMBER 23 – 30

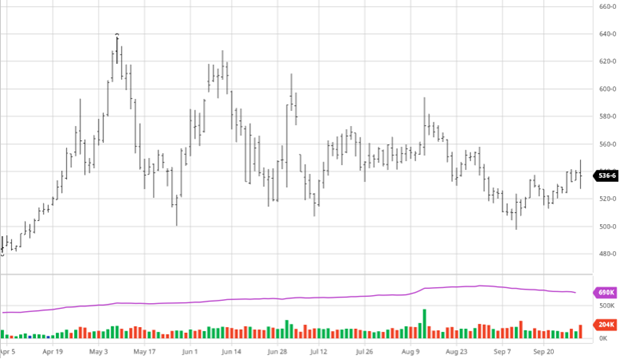
Corn took it on the chin upon the release of Thursday’s USDA report before bouncing back to finish only slightly lower on the day, but still up on the week. The report may have left more questions than answers hanging around as they raised ending stocks, but as we mentioned last week, the current basis and cash markets hint there may be less corn out there than the USDA believes. Corn stocks came in at 1.236 billion bushels, which was higher than the average estimate going in. Harvest was 18% done at the start of the week, and further progress will have been made with favorable harvest conditions. Exports this week were not great for corn, while beans were strong. The next major report for corn will be the October 12th yield update. With harvest getting off to a fast start, it will be interesting to see if the private estimates and USDA are closer to each other than usual this far in.

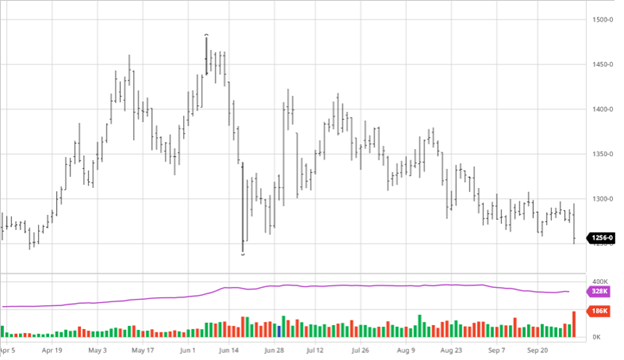
Soybeans fell post report as estimates were well lower than the USDA number of 256 million bushels. The average estimate was 174 million bushels which caused the immediate and lasting drop following the report. Obviously, nobody saw this number coming as it was well higher than the highest estimates. It is now time for the market to decide if they believe that number leading up to the October 12th yield report. Beans had great exports this week, but that was not enough to fend off the bears with the report. All the losses for beans on the week came from the report, as it had been pretty flat until Thursday. Soybeans harvested at 16% and will continue like corn this week. Like corn, the October 12th yield update will be critical as harvest has progressed further and we have a better idea of the crop.

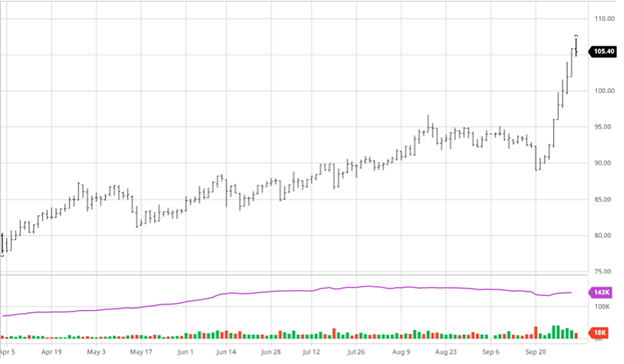
Cotton has been on a great run the last two weeks as you can see in the chart below. Cotton busted through several technical indicators in the 97 cent range while also clearing the 99.47 high from January of 2012. China has started to inquire about purchasing cotton as many companies look to import cotton and no longer use cotton from Xinjiang. Ultimately this is a supply/demand driven rally from strong global demand and uncertainty about the crop until it is out of the ground. Forecasts for rains in West Texas this weekend are not helpful for the crop and could cause issues depending on how much it does rain. Even with further upside potential to the cotton price this is a good opportunity to set floors to take advantage of this run up. As always look at your production and make the informed decision that applies specifically to your operation and not a cookie cutter plan.
Note: Since the writing above, Cotton has now topped 105 with December 2021 Cotton touching 107.28 on what seems to be a made rush of continued buying…. hold on to your hats!

Wheat
Wheat saw a post-report rally as all wheat stocks came in at 1.780 billion bushels, which was below the pre-report estimates. Keep an eye on Russia as the export tax on Russian wheat will cut acres from their regular planting and could play out in the US wheat market as well.
Dow Jones
The Dow struggled again this week as September proved to be the worst month for stocks since March 2020, when Covid hit. Rising treasuries and interest rate hikes in the future had some to do with it, but September historically is not a great month for performance. One bad month in the span of a year and a half should not ring the alarm, but it will remind everyone that stocks can go down.
Podcast
Check out our recent podcast where we’ve brought on one of our real-life firefighters from RCM Ag – Jody Lawrence, along with Tim Andriesen from the CME Group to provide us with some inside baseball knowledge of the current state of agriculture markets. They discuss the real-world application of short-dated options to potentially fight the recent blaze of volatility surrounding agriculture markets.
https://rcmagservices.com/the-hedged-edge/
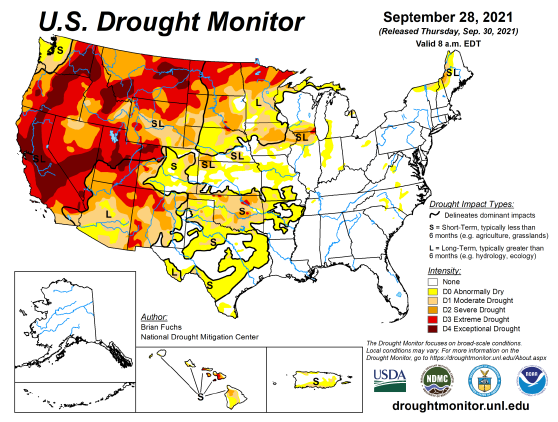
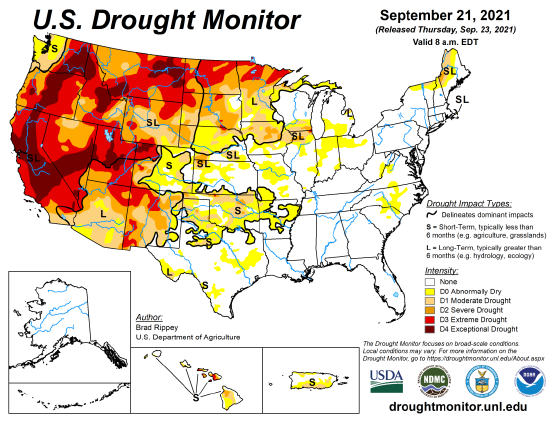
US Drought Monitor
The maps below show the US drought monitor and the comparison to it from a week ago. The outlined areas in black are areas that the drought will have a dominant impact.
Via Barchart.com