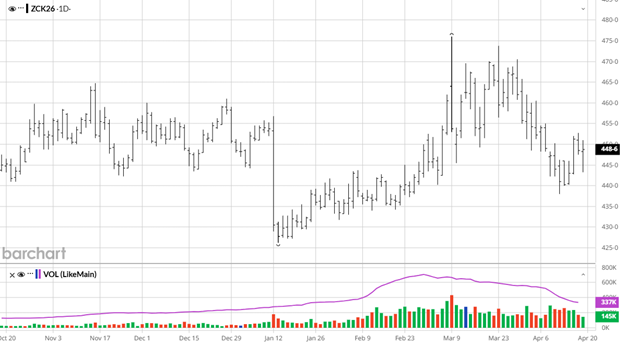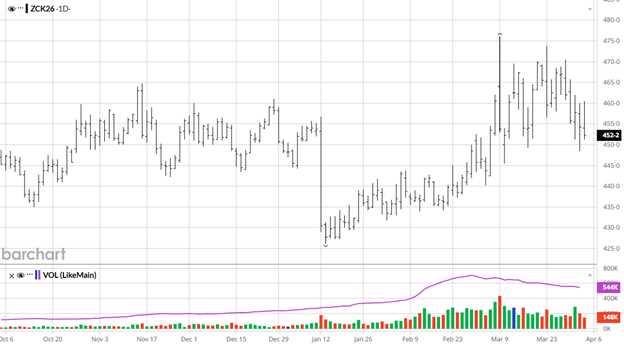


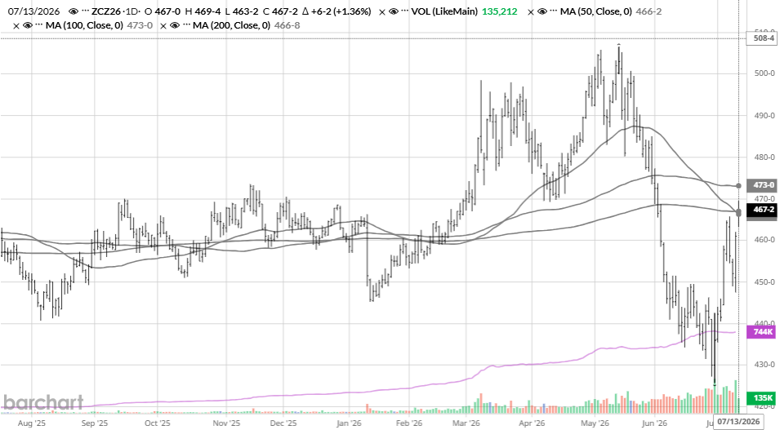
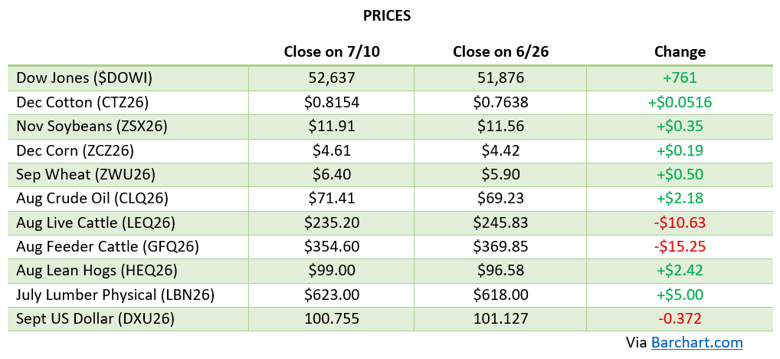
Corn spent the first half of this stretch grinding to fresh contract lows before finding its footing over the past week, catching a bid on a firming weather-risk premium heading into pollination. The June 30th Acreage and Grain Stocks reports were largely a non-event, with planted acreage at 95.343 million acres, essentially unchanged from the March intentions despite widespread expectations for a cut, and harvested acreage pegged at 87.4 million, down 4% from last year. Friday’s report delivered the bigger surprise: USDA cut 2025/26 old-crop ending stocks 125 million bushels to 2.020 billion, 50 million below expectations, on stronger feed and residual use, while 2026/27 new-crop ending stocks were slashed 170 million bushels to 1.790 billion, a full 80 million below the average guess. Production held at 16.0 billion bushels on an unchanged 183 bu/ac yield, and the season-average farm price was left at $4.40. December corn has worked back into the $4.60s on the tighter stocks numbers and improving Chinese demand optics, though the weather forecast into pollination remains the market’s next major swing factor.
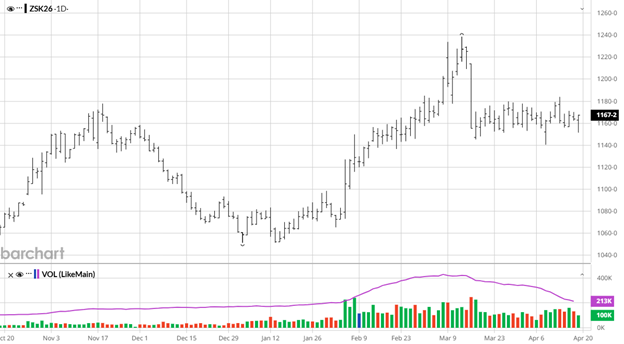
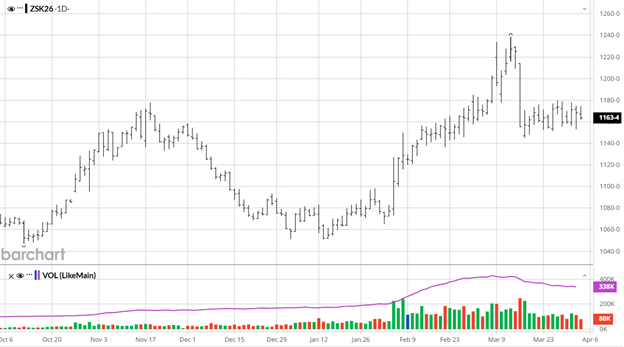
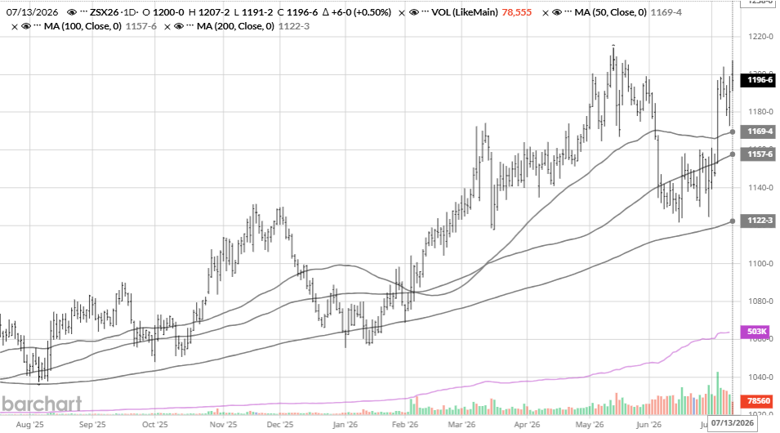
 Soybeans got a mixed signal from the June 30th reports: planted acreage came in at 85.365 million, up 5% from last year and above both the March estimate (84.7 million) and the pre-report trade guess, while June 1 stocks of 1.06 billion bushels, up 5% year-over-year, also landed above expectations, a modestly bearish combination that limited November futures to just a nickel move on report day. The real driver since has been China. After the Commerce Ministry confirmed it would roll back its reciprocal tariff on U.S. ag goods (matched by a cut to the U.S. fentanyl-related tariff), actual purchases followed in short order: a 17.3-million-bushel private sale, another 9.7 million bushels ahead of the WASDE, and Chinese state trader Cofco booking at least six cargoes for September/October shipment. That buying pushed November beans to their best levels in about five weeks, briefly testing the $12 mark. Friday’s WASDE raised 2026/27 production to 4.475 billion bushels on higher harvested acres (yield held at 53 bu/ac), but stronger exports kept ending stocks unchanged at 310 million bushels, still 20 million below expectations, with the season-average price left at $11.40. With crush margins still historically strong, beans remain the more fundamentally supported half of the row-crop trade.

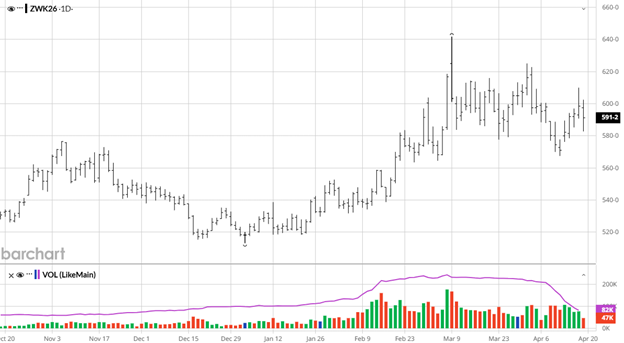
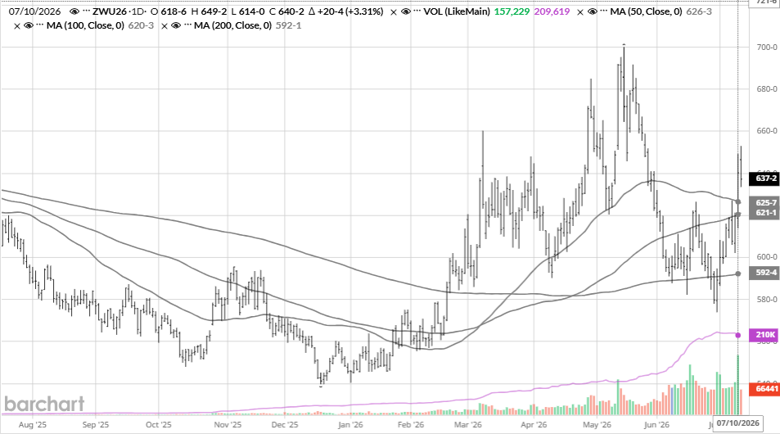
Wheat’s acreage story leaned bullish out of the June 30th report: all-wheat plantings came in at 42.740 million acres, down 6% from last year and below both the March intentions (43.775 million) and the trade guess, with winter wheat acreage at 31.5 million, down 5%. June 1 stocks were up 8% year-over-year at 920 million bushels. Friday’s WASDE confirmed just how tight the new-crop winter wheat situation is: production was cut to 990 million bushels (HRW at 471 million, SRW at 287 million), while stronger spring wheat production (475 million) helped total all-wheat production land at 1.536 billion bushels, the smallest crop since 1970. 2026/27 ending stocks came in at 722 million bushels, and the season-average price held at $6.00.
The bigger story for wheat this week has been geopolitical rather than fundamental. Ukraine’s drone forces reportedly carried out 35 strikes against Russian vessels in the Sea of Azov over a 96-hour span, hitting roughly a quarter of all ships in the area, and there are now unconfirmed reports that Russia may close the Don-Azov Canal and the Kerch Strait in response. With 30-35% of Russian wheat exports moving through that corridor and Russia projected to account for more than 22% of global wheat exports this year, as much as 20 million metric tons of wheat could be bottled up if the closure holds. Chicago wheat spiked more than 2% on Friday to $6.33, its best level since late May, a fast-developing story worth watching closely into next week.

Equity Markets
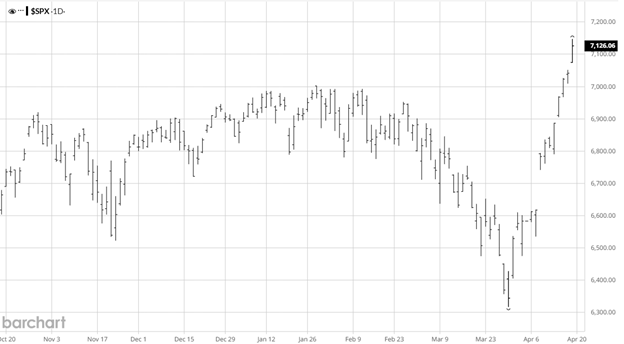
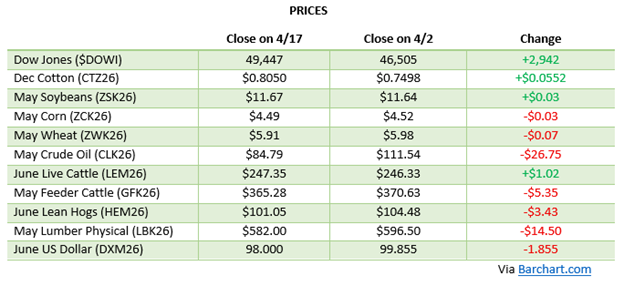
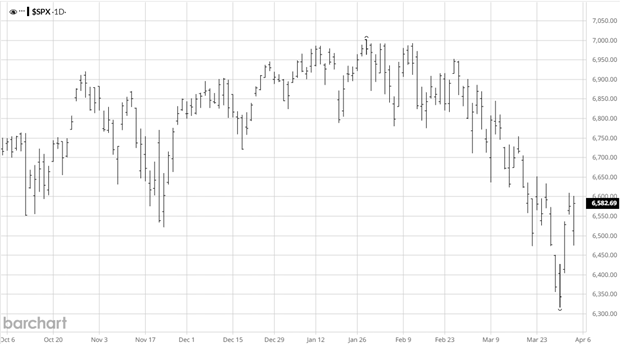
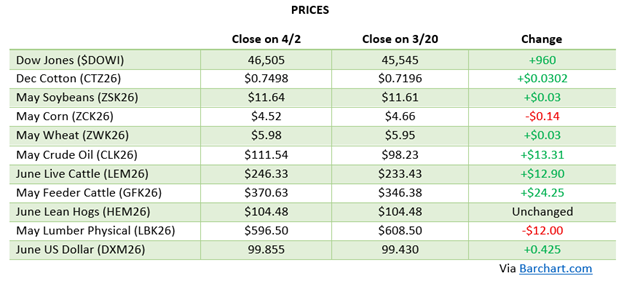
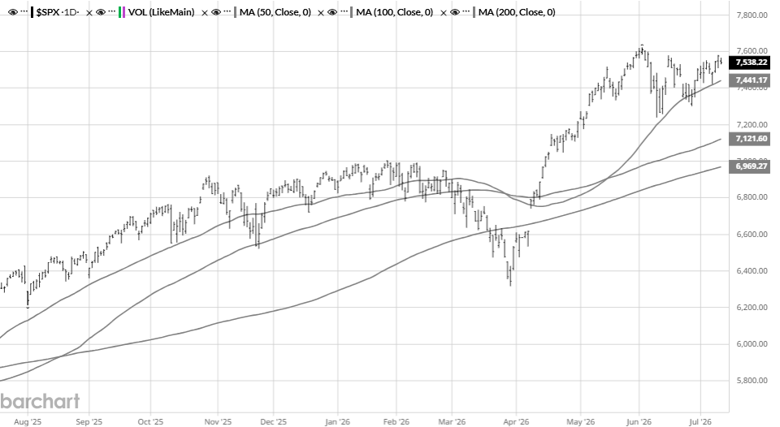
Equity markets closed out an outstanding first half of 2026 and haven’t slowed down since: the Dow gained 8.9% in H1, its best first half since 2021, while the S&P 500 and Nasdaq rose 9.6% and 12%, respectively, and the small-cap Russell 2000 posted its best first half since 1991 at nearly +22%. The Dow has continued notching fresh records since, closing above 53,000 for the first time on July 6th. AI-related names have been choppy, a sharp selloff in Micron, AMD, and Intel on valuation concerns gave way to a renewed rally after SK Hynix’s U.S. share offering came seven times oversubscribed. A soft June jobs report (57,000 vs. roughly 115,000 expected, though unemployment ticked down to 4.2%) and renewed U.S.-Iran hostilities, including fresh U.S. strikes on Iran July 8th, have added some volatility, but the VIX sitting near six-month lows below 16 shows just how much confidence remains in this market.
Energy Markets
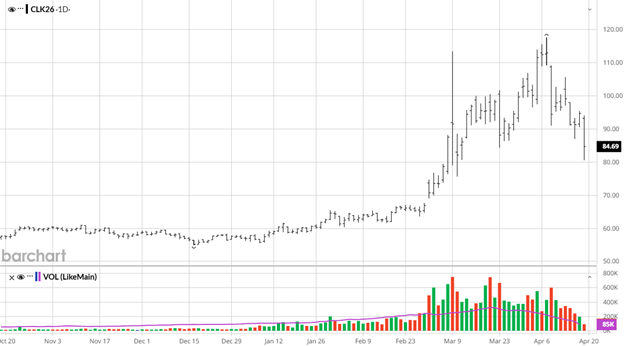
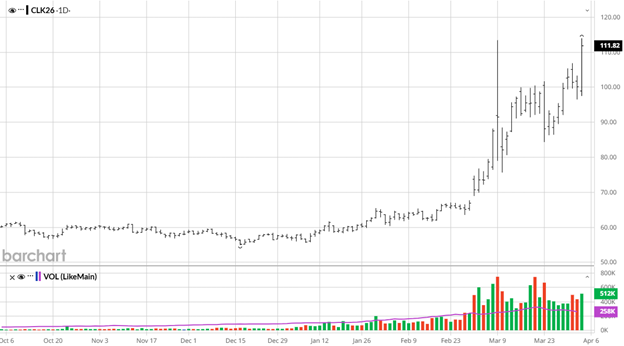
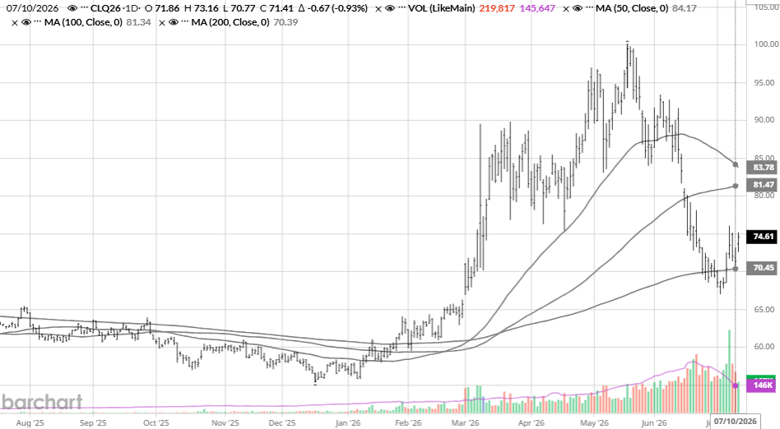
Crude oil has chopped higher since our last update as the Iran conflict flared back up. A weekend of tit-for-tat U.S.-Iran strikes in late June was followed by attacks on three commercial vessels, including a Qatari LNG tanker and a Saudi-flagged crude tanker, near the Strait of Hormuz on July 7th, prompting fresh U.S. strikes on Iran the next day. The Treasury also moved up its deadline on the temporary Iranian oil sanctions waiver, cutting it off July 17th instead of the original August 21st date. Brent has swung from below $70 back above $76, its highest since June 23rd, while WTI trades in the low $70s. The fertilizer and diesel cost relief that had been building since the spring ceasefire has stalled for now, worth keeping an eye on for fall input planning. Note: August crude oil (CLQ26) is approaching expiration later this month, so watch the roll to September when pricing off the front month.
Other News
– Cotton acreage came in at 9.85 million acres in the June 30th report, up 6% from last year. The July WASDE followed by raising 2026/27 production 400,000 bales to 13.7 million on the larger acreage and a slightly higher yield, pushing ending stocks up 400,000 bales to 4.1 million (a 29.5% stocks-to-use ratio). The season-average price held steady at 73 cents/lb, and December cotton has ridden the broader commodity rally back above 78 cents.
– China’s follow-through on the May Trump-Xi summit commitments has been the clearest bright spot for beans, multiple confirmed purchases (17.3 million bushels, another 9.7 million bushels, and six cargoes booked by Cofco for Sept/Oct) suggest the $17 billion / 25 MMT annual ag purchase pledge is starting to show up in actual export data, not just headlines.
– Ukraine’s drone campaign against Russian shipping in the Sea of Azov has put the Don-Azov Canal and Kerch Strait in question, a fast-developing story that could bottle up a meaningful chunk of Russian wheat exports if the closure holds.
– Renewed U.S. strikes on Iran (July 8th) following attacks on three vessels near the Strait of Hormuz, plus an accelerated Treasury deadline on Iranian oil sanctions relief (now July 17th instead of August 21st), are keeping energy and fertilizer cost uncertainty alive heading into fall input season.
Drought Monitor
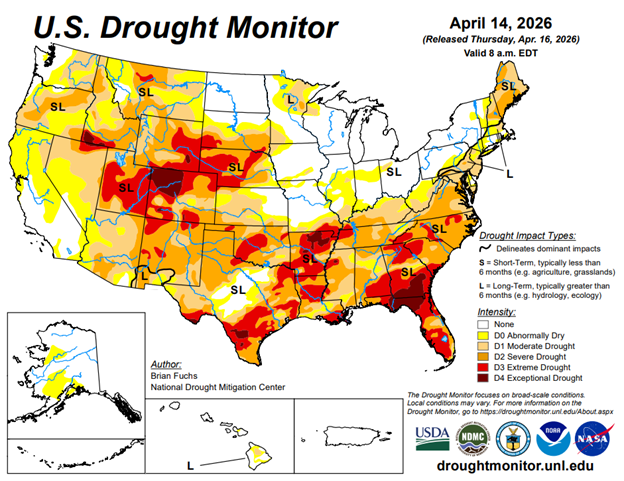
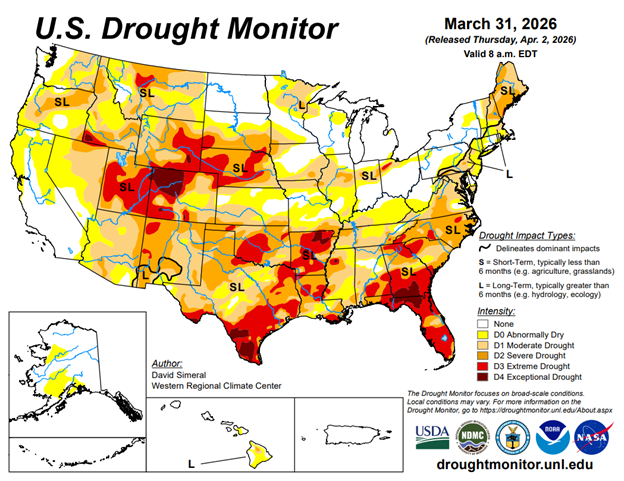
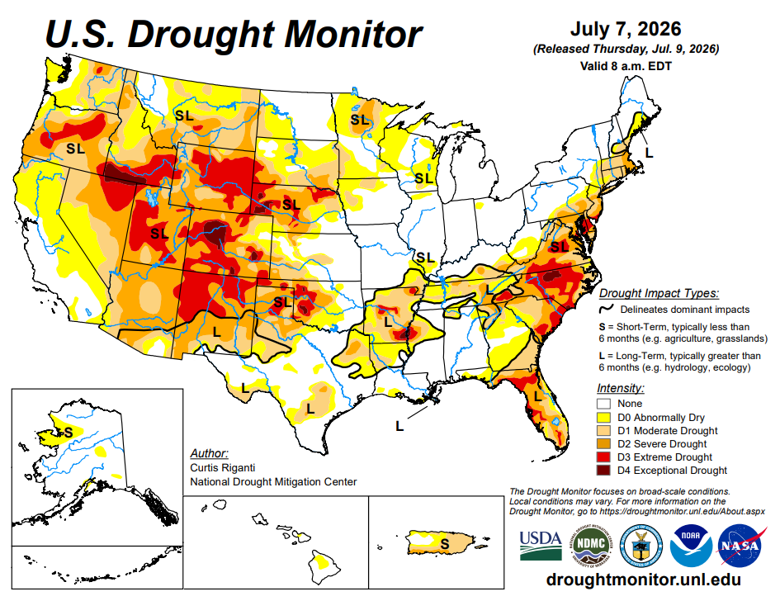
Here is the most recent drought monitor.
Contact an Ag Specialist Today
Whether you’re a producer, end-user, commercial operator, RCM AG Services helps protect revenues and control costs through its suite of hedging tools and network of buyers/sellers — Contact Ag Specialist Brady Lawrence today at 312-858-4049 or blawrence@rcmam.com.