Tag: agribusiness

08 Sep 2026

LEONARD LUMBER REPORT: THE CHALLENGE IS TO NOT SEEM TO BE HOLDING A POSITIVE TONE WHEN NO DATA SUPPORTS IT

The challenge for me is to not seem to be holding a positive tone when no data supports it. But here goes.

We came into last week with weak cash reports, which continued on Monday. By Wednesday, those few transactions had disappeared, and some mills were actually reporting better days. Items like 9′ tightened up.

So, while this is far from a roaring commitment to getting long, it does suggest there is a fight to find a bottom.

Today’s strategies and cycles are not very sophisticated. Run inventories down to the dirt and be forced to buy something. Buy when inventories get low, then sell into the rally. That is how many companies profit today. There is no glamour and very little margin in it.

At the moment, inventories are not at panic levels, so the trade is only cautiously looking at the market. The focus now shifts to the September expiration and whether there will be a debacle or not.

This is a difficult time of year to get bearish. The next round, which could also be the last meaningful move of the year, starts to define itself in early September. The trade has time to wait it out, and it likely will. I just do not see that process lasting through the traditional seasonal lows in October. It is simply not that bad out there.

The funds added another 1,000 contracts during the latest reporting period. At roughly 6,300 shorts, it appears they are once again fully invested. Open interest was stagnant to lower throughout the week, suggesting they were not adding to positions.

If that is the case, future selling pressure will likely have to come from a weakening cash market rather than another wave of fund activity. What the 6,300 figure also tells us is that the spread trade is alive and well again.

If the market reaches early October with a high level of indifference, there is at least a case to be made that a soft long bias could emerge from the roll. For now, that remains a possibility rather than a forecast, but it is something worth watching as expiration approaches.


Technical:

The technical picture is becoming well defined. The November contract appears to be building a bottom between 548.00 and 573.50. A break below 548.00 would be very destructive and would likely force a reassessment of the broader outlook. The upper trading range sits between 573.50 and 589.25. Those levels define the current trading boundaries. With the stochastics turning positive, it would take a considerable amount of selling pressure to drive the market through 548.00. By comparison, it would not take much to push futures through 589.25. A round of short covering alone could accomplish that.

Again, I am not trying to sound positive. But after a $100 correction and with much of the trade firmly in the “going to zero” camp, futures may finally be in a position to put up a fight.


Daily Bulletin:

https://www.cmegroup.com/daily_bulletin/current/Section23_Lumber_Options.pdf

Southern Yellow Pine:

https://www.cmegroup.com/markets/agriculture/lumber-and-softs/southern-yellow-pine.volume.html

The Commitment of Traders:

https://www.cftc.gov/dea/futures/other_lf.htm


About the Leonard Report:

The Leonard Lumber Report is a column that focuses on the lumber futures market’s highs and lows and everything else in between. Our very own, Brian Leonard, risk analyst, will provide weekly commentary on the industry’s wood product sectors.


Brian Leonard

bleonard@rcmam.com

312-761-263

01 Sep 2026

LEONARD LUMBER REPORT: It was another brutal week for prices

Recap:

It was another brutal week for prices as both cash and futures continued to unwind. On Wednesday and Thursday, we saw a pickup in selling from the funds into the November contract. That is not typical. Short funds do roll to the second month, but they normally do not add to positions before the front-month expiration.

So, what has changed? Most likely, the funds have started to rebuild from an extremely low position back toward full exposure. Total open interest climbed from 6,000 to 10,300 in a matter of weeks. This has been an extreme reversal and raises the open question of just how short they want to be. Is the target 6,000 shorts, 8,000 shorts, or even more?

So why all the discussion about the risk coming from a non-industry factor? Because the funds are driving the market. Price does not. Supply does not. The funds do. Over the long run, price, the economy, and supply and demand will take the lead. But when positions are being built or liquidated, those flows become the primary drivers.

For the industry, the timing is nearly impossible, but the data carries a great deal of weight. Many have bought futures and cash at levels that should prove profitable during this selloff, yet they are now showing up as done far too early. Did they maximize profits? No. But no one can factor fund momentum into otherwise sound market analysis. It only becomes visible in hindsight, when you discover you were either too early or too late.

This week, the cost of production and mounting mill losses will once again work its way into the conversation. While it may seem like a micro issue, it is a market driver across all commodities. Ultimately, it will force the market to find a trading level while the industry attempts to rebalance once again.

The timeline is relatively straightforward. The market will first determine whether the funds are moving from 6,000 shorts toward 8,000. At this point, there is little reason to expect them to pause. If they continue to build positions aggressively, futures could test the $500 level. If the pace of selling begins to slow, futures should work back toward the $580–$600 trading range, which has served as the market’s median value area for years.


Technical:

The futures market is extremely oversold. Probably much more than the data shows. November corrected Friday to 19.3% or a 2 to 1 rate of change. I don’t want to get into the weeds on this one because there is more undue pressure added to the futures side. Oscillators don’t cover this very well. The market has been sitting oversold all of August. The next push lower could create a sharp upward correction. Until then, messy is the best way to sum it up.


Daily Bulletin:

https://www.cmegroup.com/daily_bulletin/current/Section23_Lumber_Options.pdf

Southern Yellow Pine:

https://www.cmegroup.com/markets/agriculture/lumber-and-softs/southern-yellow-pine.volume.html

The Commitment of Traders:

https://www.cftc.gov/dea/futures/other_lf.htm


About the Leonard Report:

The Leonard Lumber Report is a column that focuses on the lumber futures market’s highs and lows and everything else in between. Our very own, Brian Leonard, risk analyst, will provide weekly commentary on the industry’s wood product sectors.


Brian Leonard

bleonard@rcmam.com

312-761-263

31 Aug 2026

AG MARKET UPDATE: AUGUST 12 – 31

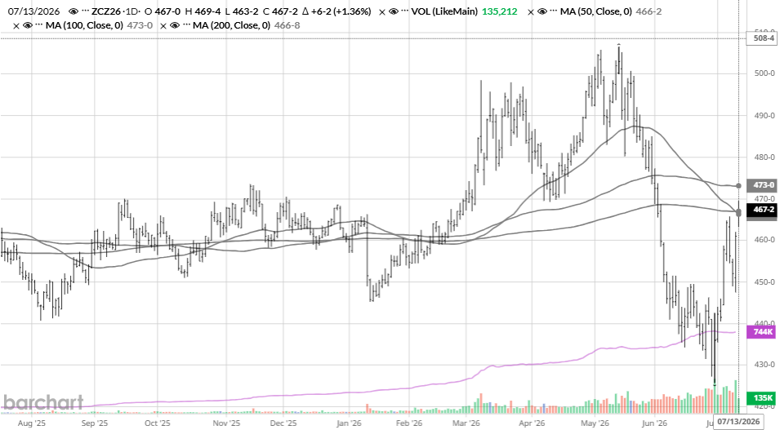
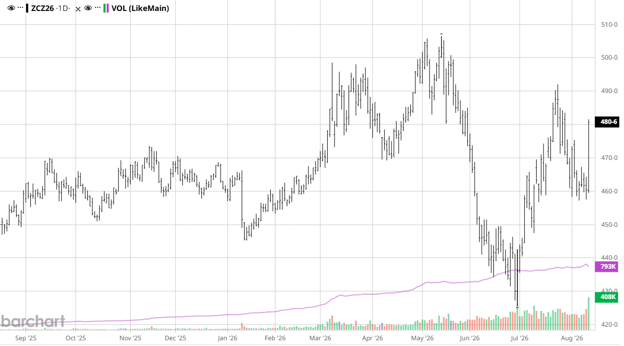
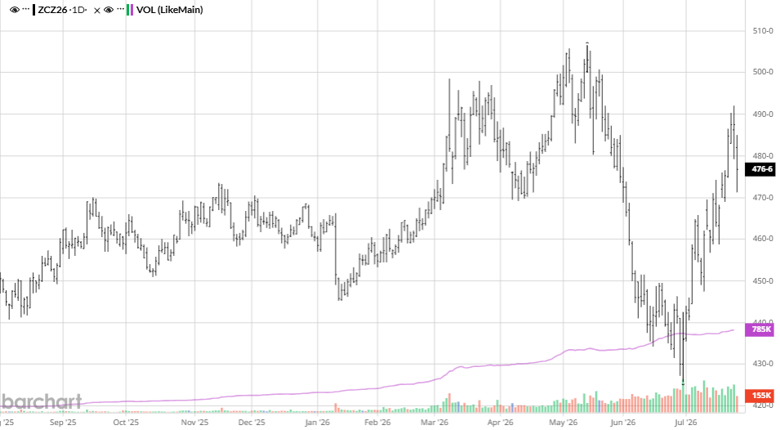
Corn has been the story of the grain complex since the August 12th WASDE, and it hasn’t been a quiet one. December corn has rallied roughly 70 cents since that report, punching through $5 for the first time since 2023 and touching contract highs. The August WASDE itself was modestly bullish, with NASS leaning more heavily on satellite and administrative data alongside its survey, trimming new-crop ending stocks to 1.653 billion bushels even as harvested acres were raised. The real fuel for the rally came a week later, when the Pro Farmer Crop Tour pegged the national corn yield at just 173.2 bushels per acre, well below the USDA’s 180.7 figure and about 10 bushels off trend. Funds piled in behind the number, pushing managed money’s net long position to its largest since April 2022, with outright long positions close to record. Weekly crop condition ratings have backed up the tour’s findings, with the good-to-excellent rating slipping to 57% as of August 23rd, while ratings go down the closer we get to harvest at these levels a record crop seems highly unlikely. Export demand has stayed a bright spot through all of this, with cumulative shipments running 26% ahead of last year’s pace and a steady stream of flash sales to Mexico. The market has room to run further if the September 11th WASDE confirms a lower yield, but the size of the current fund position also leaves it vulnerable to a sharp give-back if weather turns more favorable into fill or funds start booking profits. If you haven’t looked at pricing some new crop bushels at these levels, now is a good time to have that conversation with your merchandiser.

Via Barchart

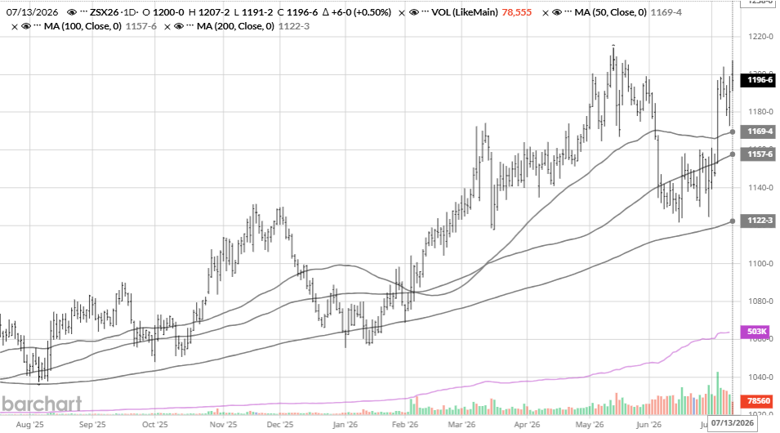
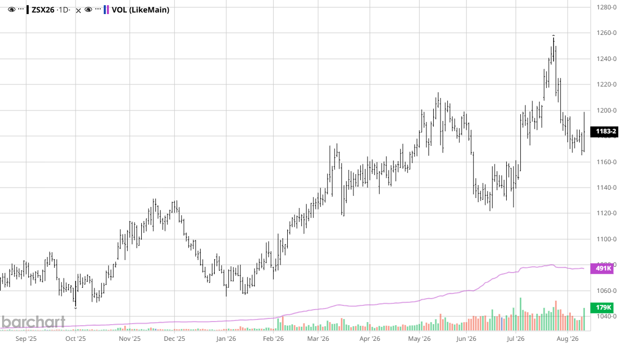
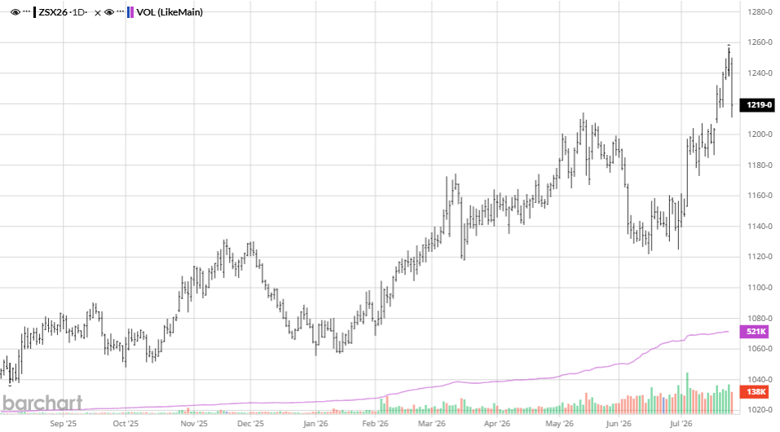
Soybeans have been the quieter half of the row-crop rally, caught between a bearish crop tour number and relentless Chinese demand. The August WASDE actually raised the national yield estimate to 53 bushels per acre and left ending stocks at a comfortable 320 million bushels, but the Pro Farmer Crop Tour turned more cautious on beans, projecting a crop of 4.572 billion bushels on a 53.3 bushel yield, a number the trade read as modestly bearish relative to corn’s tightening story. What has kept beans supported is demand: China has been buying almost daily since mid-August, with a single week’s net sales reaching 2.48 million metric tons, up 44% from the week before, as Beijing works toward the 25-million-metric-ton annual purchase commitment struck at May’s Trump-Xi summit in Beijing. A follow-up meeting between the two leaders is anticipated in September and remains a watch item for a fresh round of buying. Crush margins have stayed historically strong and continue to underpin the nearby contracts even as the funds have leaned more heavily into corn. With China’s buying pace this consistent, beans have a demand story that’s hard to ignore even if the yield picture isn’t as bullish as corn’s.

Via Barchart

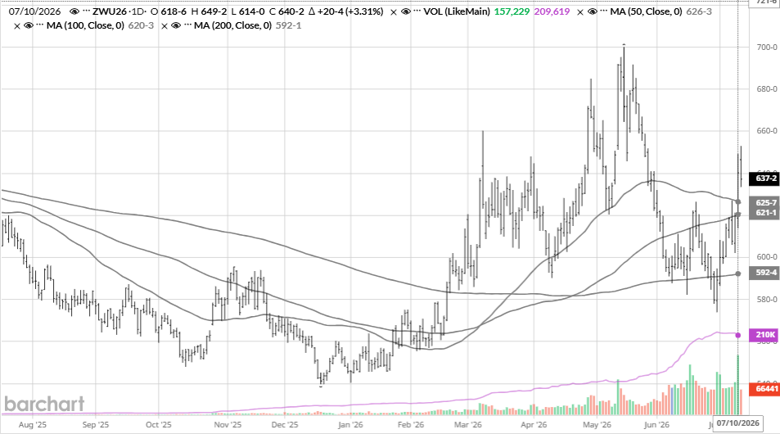
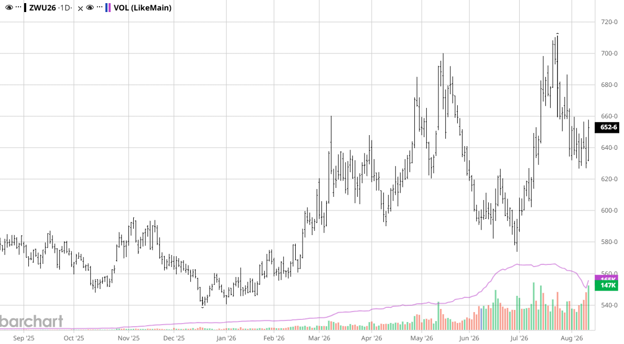
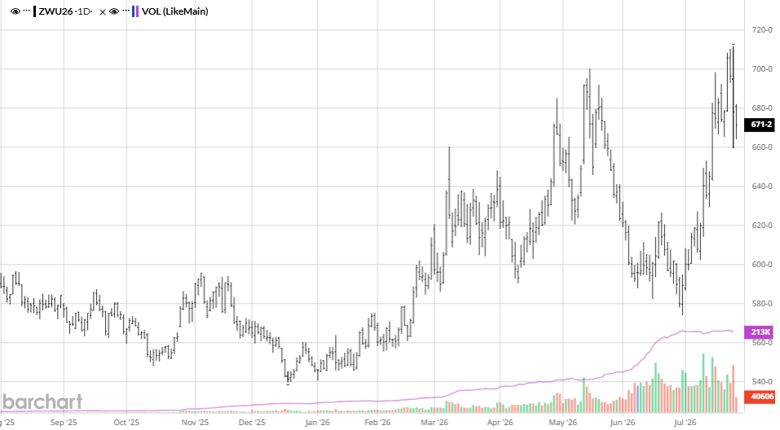
Wheat has been the biggest percentage mover in the complex, and the Black Sea is once again the reason why. Ukraine struck Russian export terminals at Novorossiysk with drones on August 12th, and the disruption has lingered, with SovEcon projecting Russian wheat exports for the month at just 3-3.4 million tonnes, well below the five-year August average of 5 million. Reports late in the period that Russia-Ukraine peace talks have hit a dead end, with Russia said to be preparing to escalate attacks, have kept a fresh war premium in the market. Domestically, the spring wheat crop has taken on its own stress story, with USDA estimating 80% of spring wheat acres in drought as of August 25th, up sharply from just 13% a year ago. Chicago SRW and Kansas City HRW have both pushed to fresh multi-week highs as a result, with September SRW trading near $6.82 and HRW above $7.50 late in the period. For now, wheat is trading headlines out of the Black Sea as much as it’s trading fundamentals, so any real progress toward a ceasefire could pull the premium back out just as quickly as it came in.

Via Barchart

Equity Markets

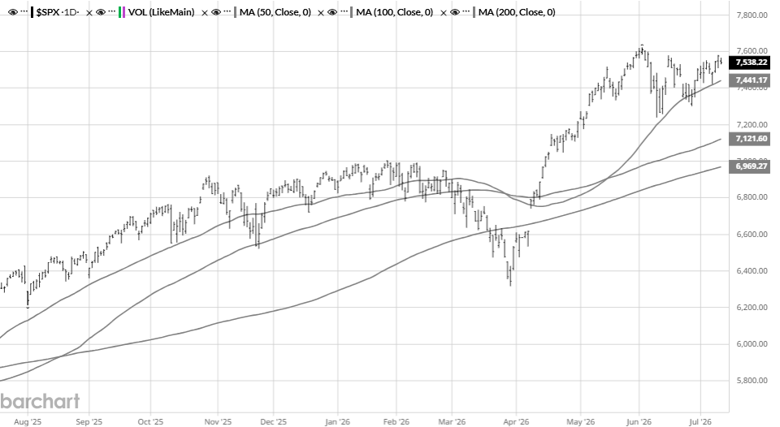
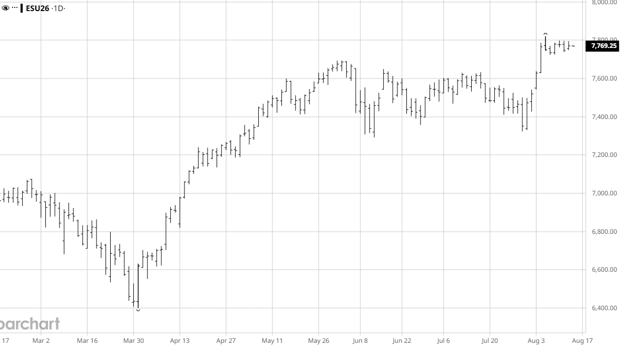
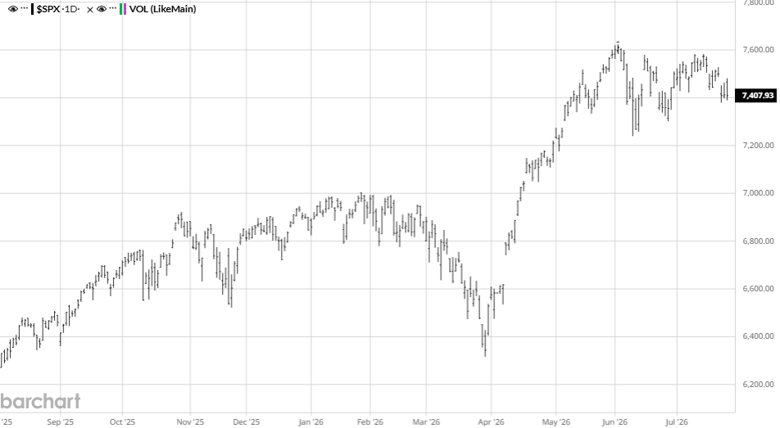
Equity markets have had a choppier stretch since the S&P 500 notched a fresh record close above 7,800 in mid-August on cooler-than-expected CPI and PPI data. Since then, renewed direct exchanges between the U.S. and Iran, including strikes on Iranian positions on Larak Island over the weekend and reported Iranian retaliation against a U.S. base in Jordan, have kept traders on edge, and the S&P 500 has spent the back half of the period essentially treading water within half a percent of its levels from three weeks ago. Rising long-end bond yields have added to the uncertainty, with the 30-year Treasury yield touching a 19-year high. The AI trade has remained the market’s ballast through the volatility, with strong earnings from names tied to artificial intelligence infrastructure and cybersecurity continuing to draw buyers even as more macro-sensitive and consumer names have been hit hard on disappointing results.

Via Barchart

Energy Markets

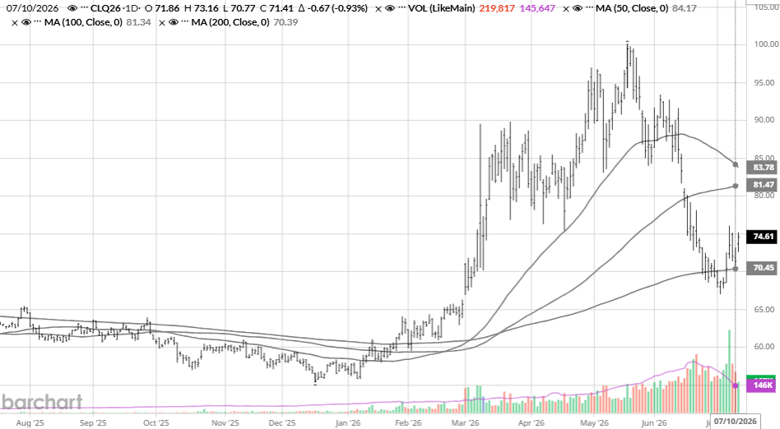
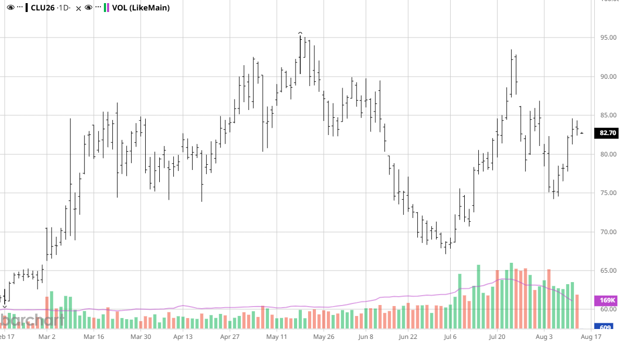
Crude oil has been the swing factor behind a lot of the volatility across both stocks and grains this period. Prices pushed toward $85 per barrel in mid-August as the Trump administration signaled it was in no rush to resolve the standoff with Iran, then reversed sharply, falling more than 5% over the following week as the U.S. pivoted toward a sanctions-based pressure campaign rather than further military action. That calm didn’t last, as fresh U.S. strikes on Iranian targets late in the period reignited the geopolitical premium.

Via Barchart

Other News

– The Pro Farmer Crop Tour wrapped up the week of August 17th, pegging the national corn crop at 15.344 billion bushels on a 173.2 bushel yield and the soybean crop at 4.572 billion bushels on a 53.3 bushel yield.

– Cotton has ridden the broader commodity rally to contract highs, with December cotton settling at a contract-high close late in the period as chart-based buying accelerated alongside the grain complex.

– The next USDA WASDE report is scheduled for September 11th.

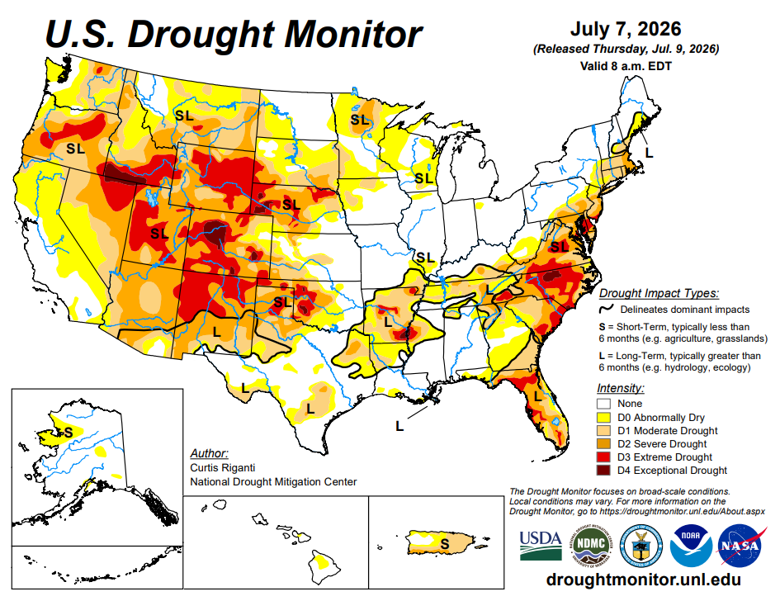
Drought Monitor

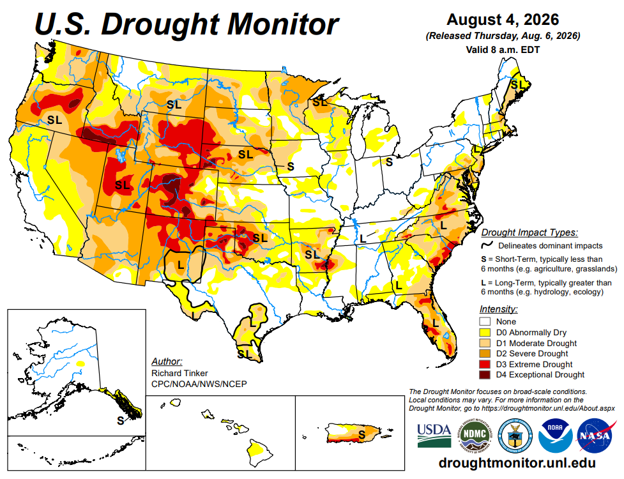
Here is the most recent drought monitor.
Contact an Ag Specialist Today

Whether you’re a producer, end-user, commercial operator, RCM AG Services helps protect revenues and control costs through its suite of hedging tools and network of buyers/sellers — Contact Ag Specialist Brady Lawrence today at 312-858-4049 or blawrence@rcmam.com.


24 Aug 2026

LEONARD LUMBER REPORT: The futures market dug itself out of the hole last week

The futures market dug itself out of the hole last week with a little help from the funds. The start of the roll slowed the computer selling, allowing the futures market to breathe. At 13%, the market was going to correct, it just needed a nudge.

On Friday, the final count for fund shorts hit 5,000. That was pre-roll. The funds did about 2,000 spreads last week, so there is more to go.

Please remember that the buying of the front month and selling of the second month is not a guaranteed rally. It just hit at the right time.

Looking at the trade on Thursday and Friday, we saw the selling become more vigorous. Open interest increased on Friday, confirming additional computer selling. The industry is not getting ready to buy anytime soon.

The next factor we have to worry about is the EFP market and whether there is any value there.

There was another dustup in the Jackie Gleason/Art Carney relationship. Needless to say, like wars, fires, and duties, unless it hits at the low, no one cares.

I was hoping that the funds would buy back some of the positions outright. That hasn’t been the case yet. The good news is that some cash items have stopped going down. It is back to a grind. 


Technical:

Sept futures cleared through most of the noise early in the week only to fall back into the middle by late Friday. With 5,700 industry longs, creating upside momentum is difficult. Having at least 80% of those longs offside also limits buying.

The market keeps developing wedge patterns, usually a sign of a sideways market. Today, the key support and resistance points are 582.00 and 567.50.


Daily Bulletin:

https://www.cmegroup.com/daily_bulletin/current/Section23_Lumber_Options.pdf

Southern Yellow Pine:

https://www.cmegroup.com/markets/agriculture/lumber-and-softs/southern-yellow-pine.volume.html

The Commitment of Traders:

https://www.cftc.gov/dea/futures/other_lf.htm


About the Leonard Report:

The Leonard Lumber Report is a column that focuses on the lumber futures market’s highs and lows and everything else in between. Our very own, Brian Leonard, risk analyst, will provide weekly commentary on the industry’s wood product sectors.


Brian Leonard

bleonard@rcmam.com

312-761-263

17 Aug 2026

LEONARD LUMBER REPORT: The data told us what we already knew

The data told us what we already knew: the funds were selling the market. The Tuesday-to-Tuesday jump was close to 2,500 contracts. That could do some damage… and it did.

The industry used the break to liquidate shorts and add longs. By Friday, the market was $20 lower, causing many to start to second-guess their move.

This is not a bad level to be long from a fundamental perspective. The issue is how much more selling the funds have left before the roll begins. Most of the time, they will slow or stop outright selling and simply roll their position forward. After such a substantial selloff, I tend to agree with that view.

The debate now is about how much damage this selloff did to the market. Many are flipping that question around and asking, “How much damage did the false rally do?”

Going into the rally, supply was contracting at roughly the same pace as demand, creating a flat but tradable range. Producers were back in the black, and the industry was enjoying improved margins.

The rally disrupted the contraction plans of many producers, and now we are back to waiting for supply to contract once again.

Trading: With the RSI sitting at 14.20%, look for a bounce. Please note that this is the third Sunday I have said that, and the market is roughly $40 lower than when I first made the call. The funds have been relentless, but they do have targets. Mill breakevens and seasonal factors are part of the equation.

If they begin to roll their positions, futures could bounce back toward the $600 area. There are no clear value targets while the funds remain active participants. Instead, we go back to prior reference points where 596 was relevant, followed by 607 and the 618 area.

This downside break damaged several technical structures, and with meaningful economic help still out of reach, the funds may not be finished with the November contract. Housing remains unaffordable, and the industry is not underbuilt. It seems only the funds see it.

The White Sox are in first. That means the futures can rally.

Daily Bulletin:

https://www.cmegroup.com/daily_bulletin/current/Section23_Lumber_Options.pdf

Southern Yellow Pine:

https://www.cmegroup.com/markets/agriculture/lumber-and-softs/southern-yellow-pine.volume.html

The Commitment of Traders:

https://www.cftc.gov/dea/futures/other_lf.htm


About the Leonard Report:

The Leonard Lumber Report is a column that focuses on the lumber futures market’s highs and lows and everything else in between. Our very own, Brian Leonard, risk analyst, will provide weekly commentary on the industry’s wood product sectors.


Brian Leonard

bleonard@rcmam.com

312-761-263

13 Aug 2026

MARKET UPDATE: JULY 24 – AUGUST 12

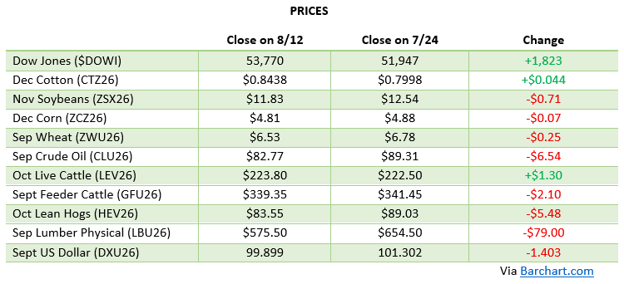
Corn caught a bid on today’s August USDA Crop Production and WASDE report, the first survey-based, field-sampled yield estimate of the season, and the market did not get the bearish surprise many were bracing for. USDA cut the national corn yield to 180.7 bushels per acre, down 5.8 bushels from last year’s record 186.5 bpa, while also finding an extra 1.4 million planted acres, pushing total planted area to 96.7 million and harvested area to 88.6 million. Total production still landed at 16.013 billion bushels, which would be the second-highest crop on record if realized. The bullish twist was on the demand side of the balance sheet: with higher exports and lower beginning stocks, USDA trimmed 2025/26 ending stocks to 1.945 billion bushels and 2026/27 ending stocks to 1.653 billion bushels, both below trade estimates, pulling the stocks-to-use ratio down to roughly 10.1%. The report comes after a rough June for corn bulls, when Managed Money liquidated long positions aggressively into the Memorial Day-to-mid-June stretch and left December corn defending the $4.40 area. The crop still has a ways to go before it is made, and weather remains the swing factor: national good-to-excellent ratings stood at 61% as of August 10, a steep 12-point drop from a year ago, with the western Corn Belt states from North Dakota down through Texas carrying notably lower expected yields than 2025.

Via Barchart

Soybeans had a positive report reaction even though the headline numbers were less bullish than corns. USDA pegged the 2026 bean yield at 52.7 bushels per acre, just a touch below the average trade estimate of 52.9 and down slightly from last year’s final 53.0, but a 1.4-million-acre increase in planted area pushed total production to a record 4.519 billion bushels, up 6% from 2025. Ending stocks were actually raised across the board versus trade guesses, both old-crop (325 million bushels) and new-crop (320 million bushels), which would normally read as bearish, but the broader complex strength and a genuinely encouraging demand backdrop carried beans higher. That demand backdrop has real teeth behind it: China has stepped back into the market with five separate flash-sale announcements since August 3, totaling roughly 1.12 million metric tons in the past week alone, and outstanding 2026/27 sales to China stood at 3.11 million metric tons (114.3 million bushels) as of July 30, about 12% of a rumored 25-million-metric-ton full-year purchase target. The crop is far from finished, with 62% of the nation’s beans setting pods as of August 2 and good-to-excellent ratings at 63%, down 6 points from a year ago, so timely August rain during pod fill remains the key variable to watch.

Via Barchart

Wheat was another big mover on report day, up 20 to 13 cents across contracts with September futures trading near $6.34. The USDA numbers themselves were fairly neutral to modestly bullish, with all-wheat production pegged at 1.531 billion bushels versus a 1.525 trade estimate and 2026/27 ending stocks trimmed to 717 million bushels from 722 million in July, while world stocks were nudged higher to 273.25 million metric tons. The bigger story for wheat over the past two weeks has been the Black Sea, where intensified Russian and Ukrainian drone and vessel attacks on grain terminals, including a strike that halted operations at Novorossiysk. Ukraine has trimmed its 2026/27 grain export forecast by as much as 12%, and Russian wheat exports are now expected to fall to their lowest level in nearly a decade, with IKAR cutting its export forecast by 500,000 tonnes to 44.5 million tonnes. Weak international demand and ample supply on paper have kept a lid on the rally so far, but the shipping-risk premium is a real and growing factor heading into the peak Black Sea export season.

Via Barchart

Equity Markets

Equity markets have continued to grind to fresh records since our last update, with the S&P 500 closing at an all-time high of 7,757.64 on August 7, capping its best week since April on a 3.6% weekly gain, while the Dow closed above 54,000 for the first time and the Nasdaq rode a sharp rebound in AI and chip names back toward its early-June highs. With 86% of S&P 500 companies beating earnings estimates this season, the fundamental backdrop has given investors cover to keep buying dips. This week’s CPI, PPI, and retail sales data will be the next real test of whether the rally has room to keep running or whether hotter inflation data forces the rate conversation back the other way.

Via Barchart

Energy Markets

Crude oil has reversed sharply higher after bottoming in the upper $60s to low $70s in late June, with WTI grinding higher for five straight sessions into today’s close near the mid-$80s and Brent trading close to $89. The renewed strength is tied back to Middle East uncertainty: Iran has been pushing for war-compensation demands from the US and Israel as a condition for any lasting deal, and while Pakistan’s defense minister has said the US and Iran are close to an arrangement on reopening the Strait of Hormuz, President Trump’s more combative rhetoric this week has kept traders guessing on timing. Attacks on vessels in the Red Sea and Gulf of Oman have added a fresh layer of shipping-risk premium on top of the Hormuz uncertainty.

Via Barchart

Other News

– Black Sea shipping risk is back in focus for wheat, with Ukraine and Russia increasingly targeting each other’s port and vessel infrastructure. Turkey has temporarily suspended some Black Sea transit operations amid the escalating security concerns, and both countries have cut their near-term export forecasts even as underlying production is running slightly ahead of the five-year average.

– China’s return to the soybean market with repeated flash-sale purchases since early August is the most constructive demand headline the bean market has had in months, though at roughly 12% of a rumored 25-million-metric-ton target, there is a long way to go before it fully offsets the shortfall from earlier in the marketing year.

– Cotton continues to take its cues from the broader energy and commodity complex; the recent bounce in crude could put a firmer floor back under natural fiber pricing versus petroleum-based synthetics after a quiet summer.


Drought Monitor

Here is the most recent drought monitor.
Contact an Ag Specialist Today

Whether you’re a producer, end-user, commercial operator, RCM AG Services helps protect revenues and control costs through its suite of hedging tools and network of buyers/sellers — Contact Ag Specialist Brady Lawrence today at 312-858-4049 or blawrence@rcmam.com.


10 Aug 2026

LEONARD LUMBER REPORT: these fires are a real issue. We will see if they have any impact on our market.

Note: these fires are a real issue. We will see if they have any impact on our market.

We will start the commentary out with Commitment of Traders. It comes out for the Tuesday-to-Tuesday report, so it lags. Up until Tuesday, most of the trade was blowing out. The industry exited shorts and the funds exited longs. From Wednesday on, open interest started to grow again, with the guess being that the industry added longs while the funds added shorts.

What we continue to see time and again is the short funds getting out only to come roaring back. The fact that the housing market continues to tread water year after year is a contributing factor.

So let’s take a macro look at the economy in general and the trickle-down effect.

There are two opposing features to housing today. The first and greatest is the affordability issue. New and existing home prices are not coming off. At 6.5% and a Q2 median home price of 410,700, you have an overbuilt condition. At 5.5% and 350,000, you have an underbuilt condition. A 6.5% mortgage rate puts futures at 570. A 5.5% rate puts futures at 770.

We continue to be in this tremendously volatile situation. The market has been flat for a few years now, but the upside potential continues to grow.

Typically, a commodity will not stay below producers’ breakeven levels for long. The market is not seeing a steep decline in building activity; instead, construction remains relatively steady. With the announced shutdowns, we would expect producers to begin creating some upward momentum.

For the first time, we are seeing a more regionalized lumber market. Canada is dealing with production challenges as well as duties and fees, but its largest customer—the single-family housing sector—remains sluggish. It is the multifamily sector that is holding things together, and that market is supplied primarily by U.S. producers, who have the ability to add production and generally operate more efficiently.

As a result, the Canadian producer is facing a different set of fundamentals than the U.S. producer. That divergence is creating a market dynamic that has not been seen before. That is why we have two separate lumber contracts, because we have 2 separate markets. That is also why the spruce contract isn’t $700 on its way to $800. Pine is a substitute in many cases. 

Today, the raw data is straightforward: the futures market is trading at a deep discount to cash, and the RSI sits at 15.5%. Historically, these are the types of conditions where inventory is added through the futures contract.

With the funds selling once again, any recovery is unlikely to be a roaring rally. Instead, the market will probably have to work its way higher. That brings the $618 area back into focus as an important reference point.

The September roll is also approaching, and the associated buying could provide a modest tailwind to the upside. While it may not be enough to dramatically change the landscape, it could help support a rebound if the selling pressure from the funds begins to ease.

Daily Bulletin:

https://www.cmegroup.com/daily_bulletin/current/Section23_Lumber_Options.pdf

Southern Yellow Pine:

https://www.cmegroup.com/markets/agriculture/lumber-and-softs/southern-yellow-pine.volume.html

The Commitment of Traders:

https://www.cftc.gov/dea/futures/other_lf.htm


About the Leonard Report:

The Leonard Lumber Report is a column that focuses on the lumber futures market’s highs and lows and everything else in between. Our very own, Brian Leonard, risk analyst, will provide weekly commentary on the industry’s wood product sectors.


Brian Leonard

bleonard@rcmam.com

312-761-263

03 Aug 2026

LEONARD LUMBER REPORT: Fifty dollars in five days. Lumber futures gave it all back.

Fifty dollars in five days. Lumber futures gave it all back.

While there was weakness in the cash market, it was nowhere near that severe. There were many combinations of players involved, but at the end of the day it was the algo-driven push that unraveled the move. That forced the longs out and brought the industry in.

The Commitment of Traders report adds another layer of confusion, as it shows funds getting longer. The issue is that the data only runs through Tuesday, so it does not yet provide a complete picture of the market’s current makeup.

To keep it simple, this appears to be some type of computerized trade. The larger the bid in the deck, the faster the system reacts to selling it. That is not a typical lumber trader. 

One thing worth noting is that, just as with the previous rally, the computer-generated activity creates a great deal of air in its wake.

As I mentioned earlier in the week, whatever the reason, at these levels does the market present opportunity?


The mortgage rate creep can’t be discounted using the supply excuse. I was just bragging about it headed lower. With this back and forth, I would not expect the builders to deviate in the second haft from their original construction plans. 

It’s no surprise that the technical read turned negative. The tradable factor is that the market remains in the uptrend that began last November. That trendline currently comes in at 581.20, leaving plenty of room from today’s levels.

The negative is that the stochastics crossed lower on the weekly chart last week. Once that signal changes direction, it tends to remain in place for several weeks. The last crossover occurred in late May and was to the upside.

With the daily RSI at 26%, some back-and-forth trade would not be surprising. Longer term, the major support areas continue to be 618, 600, and 580.

The computer-driven selling pushed the market through 618 as if it were not even there. If the algo influence fades, attention will likely shift back to the 200-day moving average, which currently sits at 636.10. That level could quickly become an important reference point for both traders and the industry.


The bigger question remains whether the recent selloff has created opportunity or simply reset expectations after an extended rally. The answer will likely depend on whether the market can stabilize above key support levels and whether the cash market begins to confirm the futures action.

27 Jul 2026

LEONARD LUMBER REPORT: Futures rallied nearly $30 last week

Futures rallied nearly $30 last week and more than $60 over the last two weeks. That is a substantial move. The rally actually began back in November 2025 and is now up roughly $170 from those lows.

The data is not showing a major increase in demand. We have been seeing production slow over time, but is that enough to justify a $60 move in two weeks and a $170 advance overall? The funds may think so.

Open interest bottomed near 6,200 and now sits above 8,000 after only a few sessions. The Commitment of Traders report shows an increase in fund longs, but also a jump in industry participation on both sides of the market.

The pace of the cash market remains muted, yet prices continue to grind higher. Futures will need willing buyers at these levels to sustain the rally. If futures continue higher, the cash market is likely to follow.

From a macro perspective, this market is increasingly becoming a debate between balance and imbalance. We came into the year with what appeared to be a fairly balanced supply-and-demand picture, alongside an oversupplied housing market. Today, that housing oversupply is beginning to come down. Again, is that enough to justify the move? Probably not unless interest rates begin to decline.

Another question mark that emerged last week was the shift in economists’ views on true housing demand. The loss of immigration and an aging population suggest that less housing supply may be needed than previously believed. Will builders be forced to lower their outlooks on a year-over-year basis? That question could add another layer of volatility to the trade, and it may already be contributing to the current rally.

The futures run early in the week pushed the market into overbought territory. The Thursday-Friday trade corrected some of that condition, which is a healthy development.

What to watch now is the technical picture. The short-term moving averages are close to crossing above the 200-day moving average for the first time in years. That is a very positive indicator, but it is not necessarily a buy signal. It may simply be confirming the thesis that the typical trading range has shifted higher.

The key level this week is 660.00. That represents the 81% retracement of the 2025 trading range. A close above 660.00 could open the door to a push back toward 700.00.

A modest correction would be healthy. The last move to 700.00 was driven largely by noise. If the market makes another run at that level, the driving force this time appears more likely to be fund participation. Let’s give it a few days and see how it develops.


Daily Bulletin:

https://www.cmegroup.com/daily_bulletin/current/Section23_Lumber_Options.pdf

Southern Yellow Pine:

https://www.cmegroup.com/markets/agriculture/lumber-and-softs/southern-yellow-pine.volume.html

The Commitment of Traders:

https://www.cftc.gov/dea/futures/other_lf.htm


About the Leonard Report:

The Leonard Lumber Report is a column that focuses on the lumber futures market’s highs and lows and everything else in between. Our very own, Brian Leonard, risk analyst, will provide weekly commentary on the industry’s wood product sectors.


Brian Leonard

bleonard@rcmam.com

312-761-263

27 Jul 2026

AG MARKET UPDATE: JULY 10 – 24

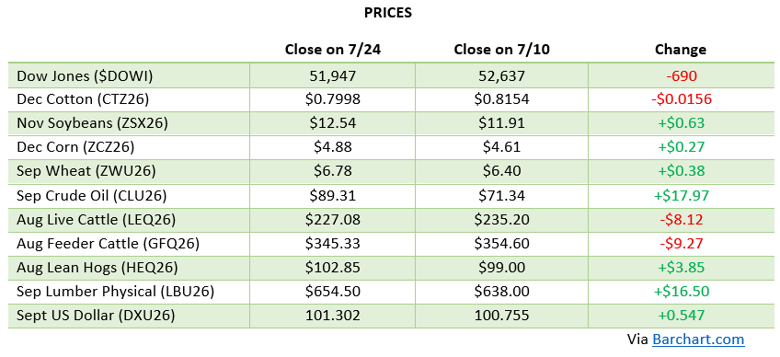
Corn caught a boost from the July 10th WASDE report, which cut 2026/27 ending stocks to 1.79 billion bushels, 200 million lower than June, on stronger-than-expected old-crop demand that trimmed 2025/26 carryout by 125 million bushels to 2.02 billion. Even with production pegged at a record 16.0 billion bushels, the tighter carryout was enough to spark buying, and December corn settled the WASDE session at $4.60. The rally extended over the following two weeks as a hot, dry pattern settled over the Corn Belt right through pollination, the most critical stretch for yield determination, with December corn touching $4.92 on July 24th, its highest intraday level since May 21st, before fading back into the $4.80s. Export demand has been the other pillar of support: 2025/26 corn sales commitments have already topped 3.41 billion bushels, up nearly 24% from a year ago and above USDA’s full-year forecast of 3.325 billion bushels, while 2026/27 bookings are running 12% ahead of last year’s pace. With the crop pushing through its most sensitive growth stage under some stress, and NASS heading into the field July 25th through August 5th for the first survey-based yield numbers of the season, weather will remain the dominant driver into the August 12th WASDE. Prices are lower to start the week of July 27th.

Via Barchart

Soybeans got a mixed signal from the July WASDE: USDA raised 2026/27 production 40 million bushels to a record 4.475 billion on higher harvested acres, but a matching bump in exports left new-crop ending stocks unchanged at 310 million bushels, while old-crop 2025/26 carryout actually tightened another 10 million to 330 million bushels. Crush held steady at a record 2.75 billion bushels. New-crop November futures have been the standout performer of the period, climbing from the low-$12 area into the $12.40s-$12.50s by July 23rd-24th, territory not seen in a new-crop contract since December 2023, as the same hot, dry forecast pressuring corn is raising concerns about pod-setting and seed fill during this critical stretch. Chinese demand has quietly turned into a real tailwind rather than just a headline, China has been a steady buyer of new-crop beans in recent weeks, and traders are increasingly optimistic that the long-delayed Trump-Xi meeting, now being framed as a late-September event, could bring another leg of purchases. We are close to the point where it wouldn’t take much more than a one-bushel-per-acre yield hit to make U.S. supplies uncomfortably tight, so August weather is squarely in the driver’s seat.

Via Barchart

Wheat also caught a bid off the July 10th report, with USDA trimming its wheat production estimate again on continued winter wheat losses, winter wheat production is now seen at just 990.5 million bushels, a 29% drop from a year ago, while spring wheat is projected 4% lower at 475 million bushels, keeping this year’s crop firmly on track to be one of the smallest in decades. Ending stocks fell another 22 million bushels to 722 million on the news, and Chicago wheat jumped over 20 cents to settle at $6.40 that session. The complex has since given back some of those gains as harvest wraps up across the Southern Plains and the market digests early results from this year’s spring wheat crop tour, which came in below both last year’s yield and USDA’s most recent guess, though a bit better than the trade feared. Black Sea supply risk remains part of the backdrop, with Russian consultancy IKAR now pegging Russia’s 2026 crop at 90 million tonnes and export potential at 44.5 million tonnes, keeping traders wary of pricing U.S. wheat too far above what the world actually needs. Export demand has been unremarkable, with last week’s sales total of 10.7 million bushels falling below the four-week average, and the wheat market looks a bit overbought technically after its recent run.

Via Barchart

Equity Markets

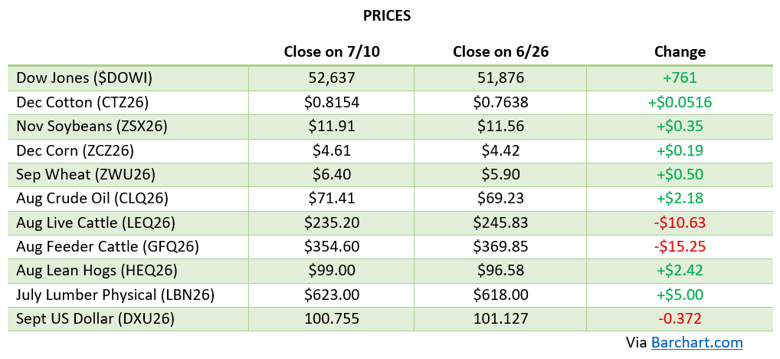
Equity markets pushed to fresh records early in the period, with the Dow topping 53,000 for the first time on July 6th and closing at 52,637 on July 10th, before the reignited Iran conflict and a wave of chip-sector weakness took some wind out of the rally. The Dow closed the week of July 24th at 51,947, still up more than 16% year-over-year, as investors weighed strong Big Tech earnings and continued AI-driven enthusiasm against renewed Middle East headline risk. Volatility has picked up as the market digests a heavy earnings calendar alongside the prospect that persistent inflation could push the Fed toward holding rates steady, or even hiking, rather than cutting further this year.

Via Barchart

Energy Markets

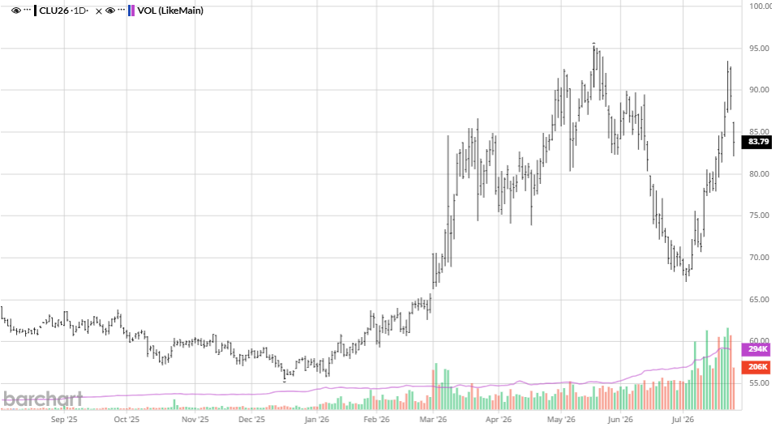
Energy markets were the most volatile corner of the entire complex over the past two weeks as the U.S.-Iran ceasefire that had briefly calmed prices in June completely unraveled. Iran’s attack on a tanker near the Strait of Hormuz on July 7th sent crude sharply higher, and the conflict escalated from there: U.S. forces have carried out repeated rounds of strikes on Iranian targets, Washington reinstated its naval blockade of Iranian ports, and Iran’s Houthi allies in Yemen declared a maritime embargo against Saudi Arabia. WTI crude has been on a wild ride as a result, swinging from the $70 handle in early July to the low-to-mid $80s at points last week, before easing modestly to close out the week as markets try to gauge whether the fighting stays contained. Some analysts now warn Brent could threaten its 2022 high near $128, or even the 2008 peak above $146, in a worst-case escalation scenario. For producers, this is the same fertilizer and diesel cost risk that flared up earlier this year resurfacing, and it is worth watching closely before locking in fall input needs.

Via Barchart

Other News

– Cotton remains a standout, with December cotton settling above 81 cents on July 10th, continuing its run to multi-year highs as elevated crude prices keep synthetic fiber costs up and support natural fiber demand.

– China has been a consistent buyer of new-crop soybeans in recent weeks, and unknown-destination purchases announced late in the period are widely believed to be Chinese business ahead of the Trump-Xi meeting now being targeted for late September.

– USDA’s NASS will be in farmers’ fields conducting the first survey-based yield interviews of the season from July 25th through August 5th, setting up the August 12th WASDE as the next major acreage and yield-driven catalyst.

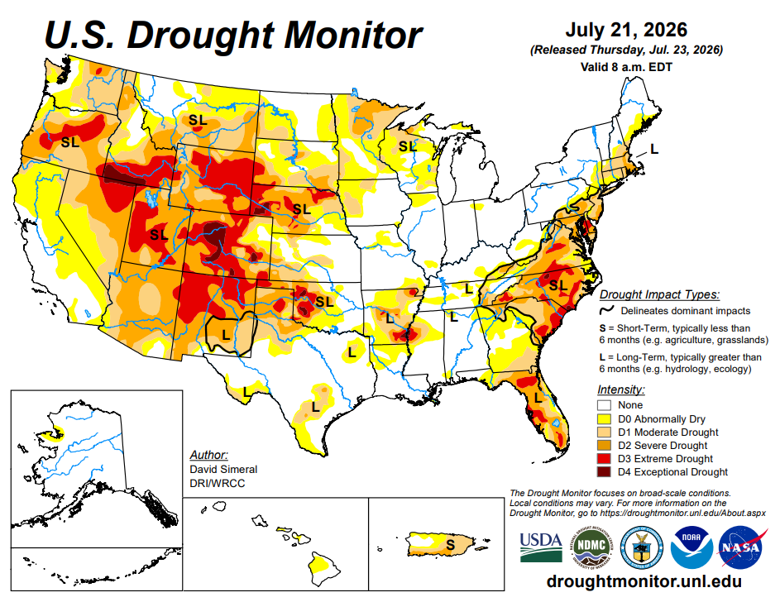
Drought Monitor

Here is the most recent drought monitor.

Contact an Ag Specialist Today

Whether you’re a producer, end-user, commercial operator, RCM AG Services helps protect revenues and control costs through its suite of hedging tools and network of buyers/sellers- Contact Ag Specialist Brady Lawrence today at 312-858-4049 or blawrence@rcmam.com.