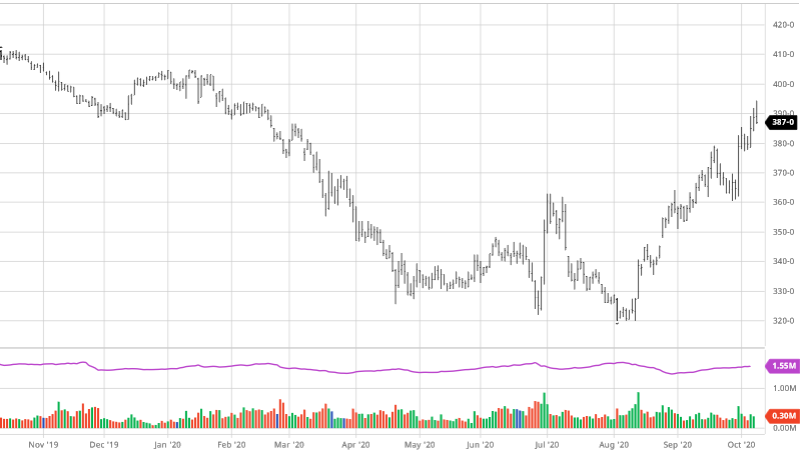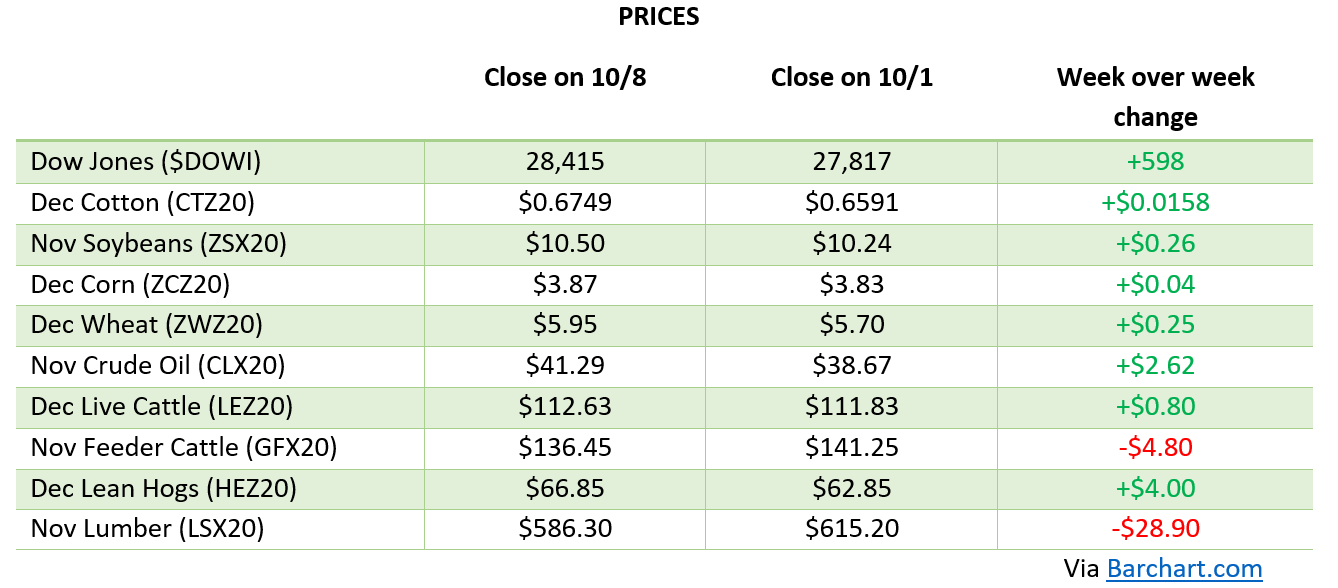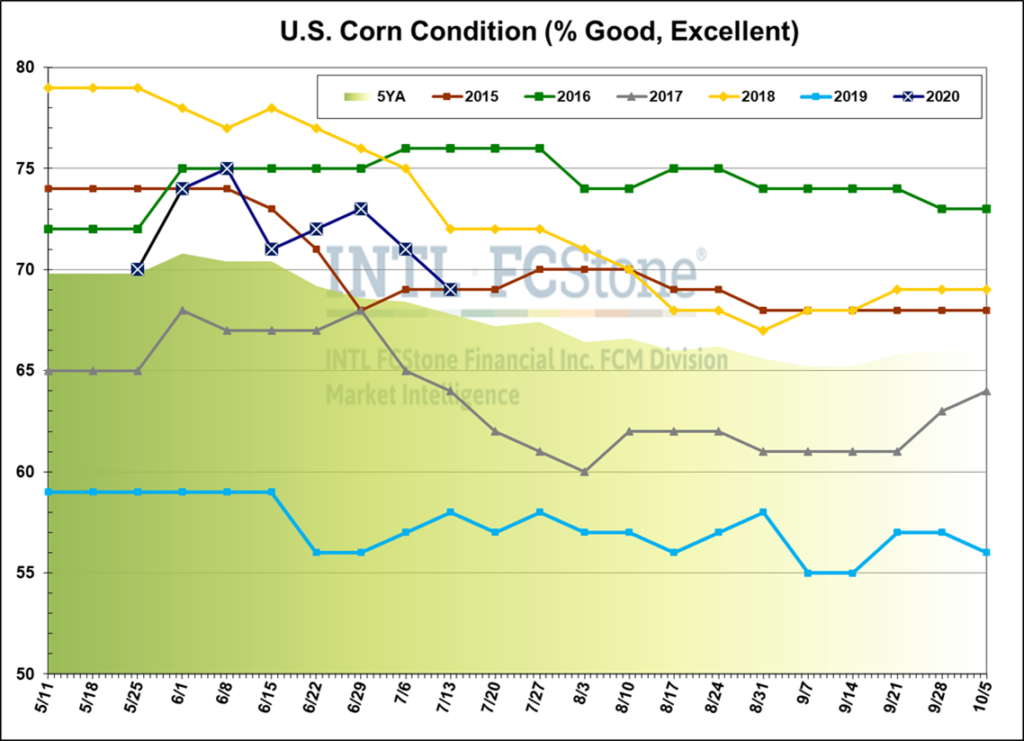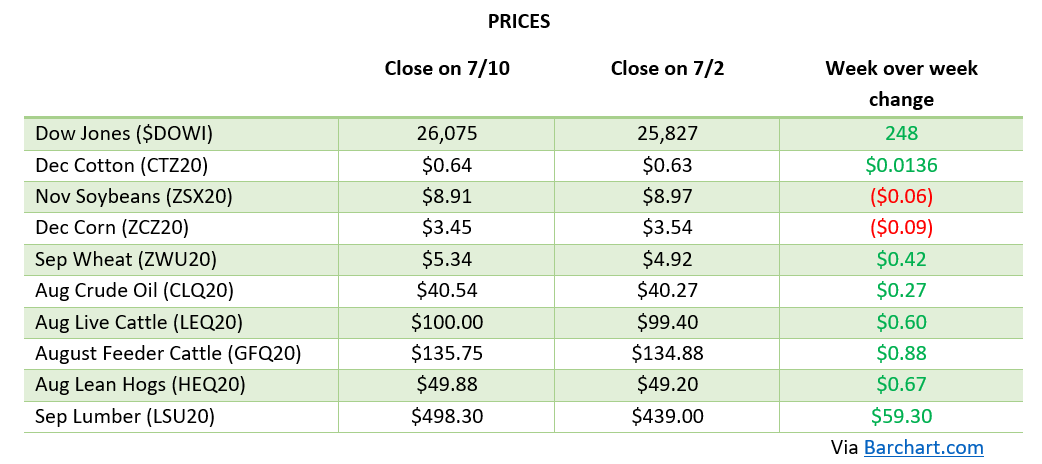
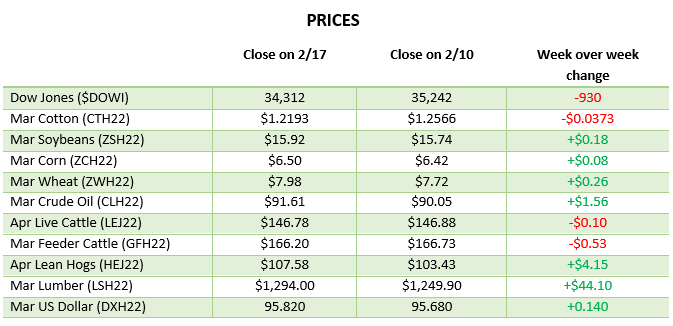
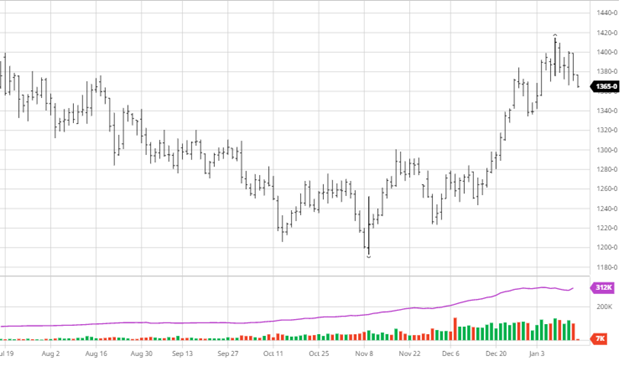
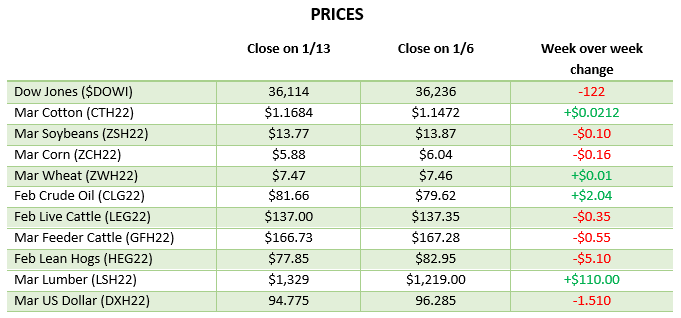
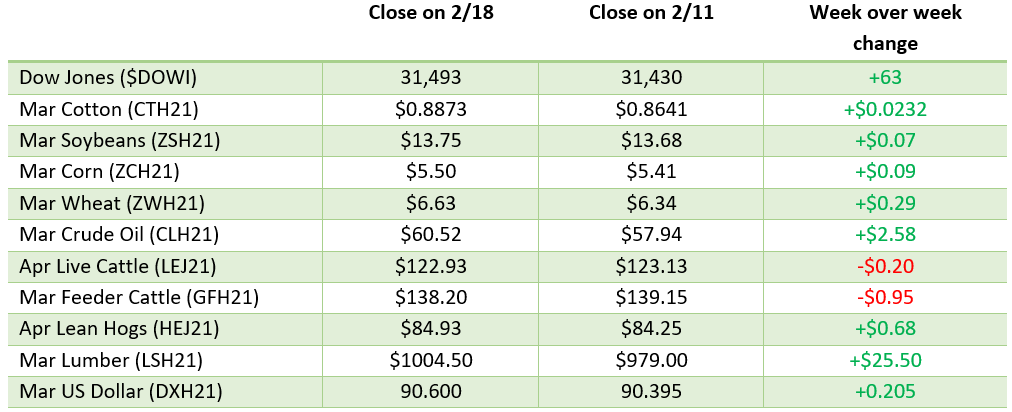
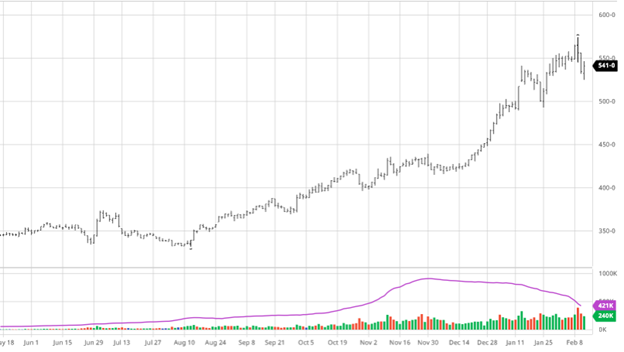
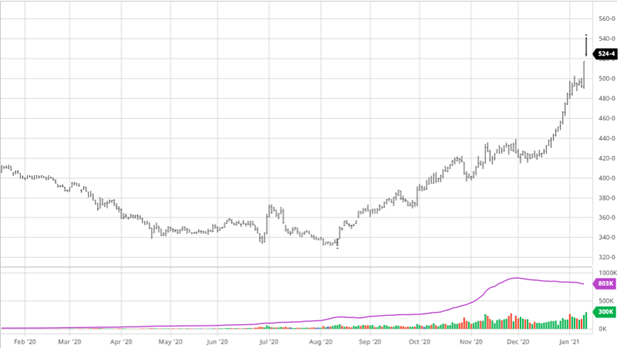
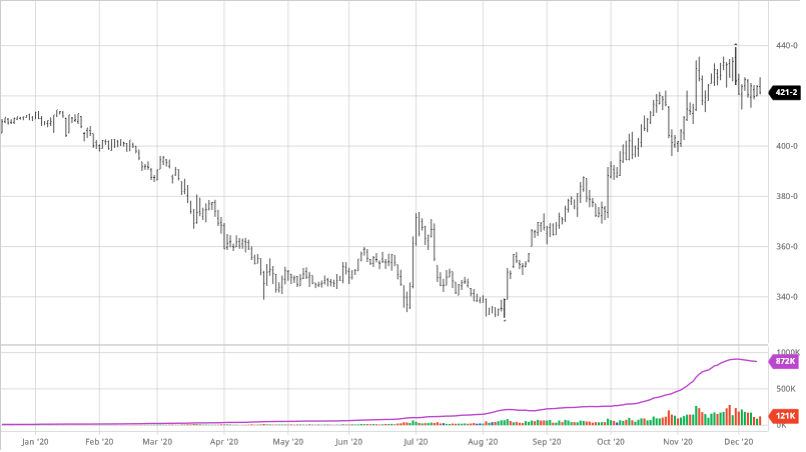
Corn made small gains on the week as grains did well across the board. The forecast for South America can’t seem to make up its mind switching back and forth on rain amounts. Argentina has consistently had rain in the forecasts, but what parts of the country and the amount has been inconsistent. Exports were better this week than last, but nothing crazy; potential conflict in Ukraine and further issues with the South American crop could see those numbers pick up soon. The markets are not open for President Day on Monday the 21st, so there is more time to develop around the world. Based on the Dec ’22 futures for corn after today, the February insurance price is $5.84 ¾.
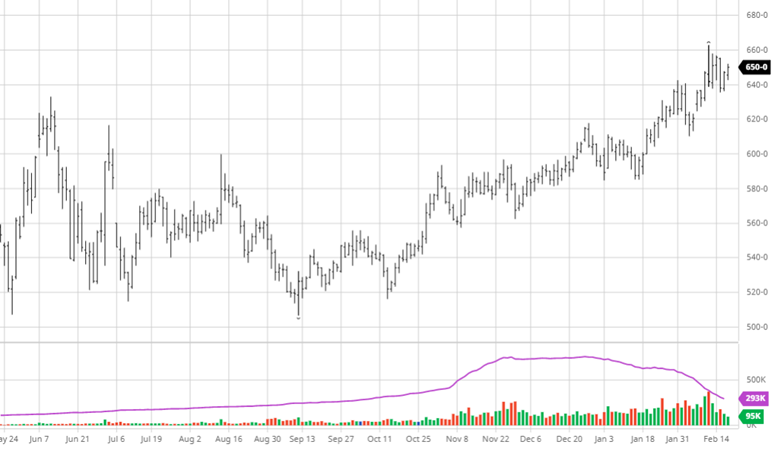

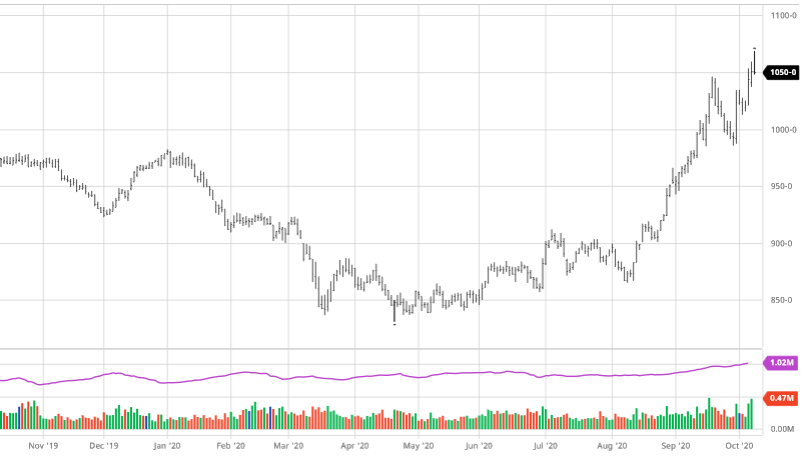
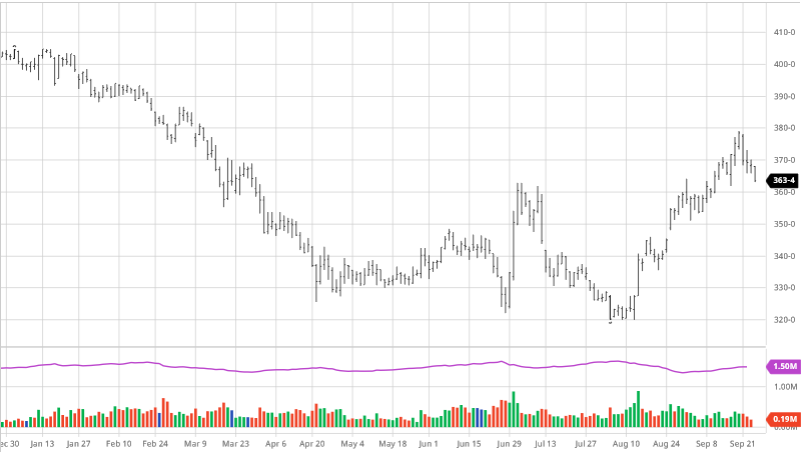
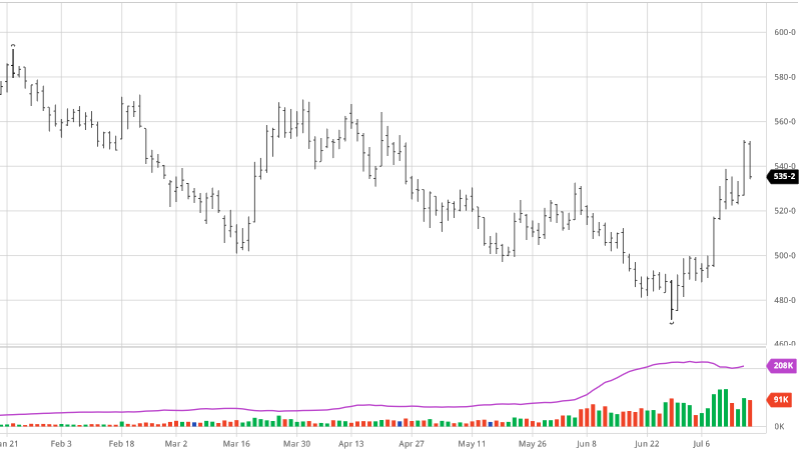
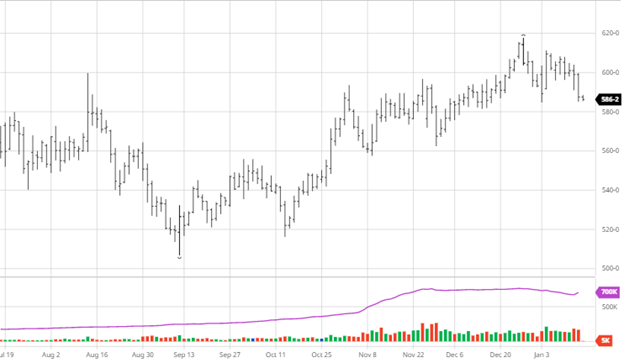
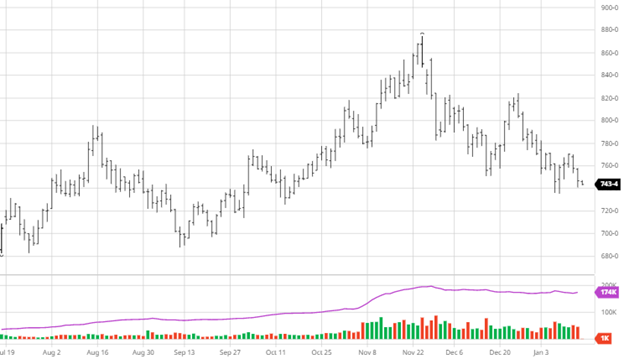
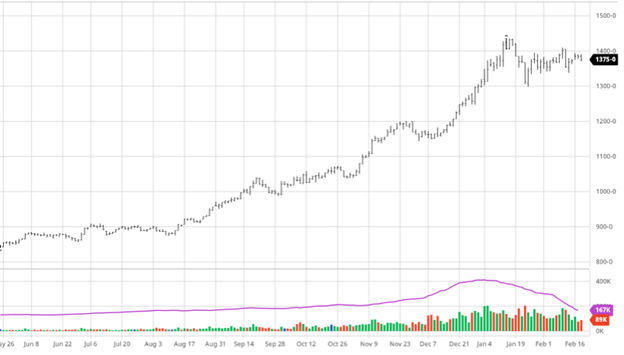
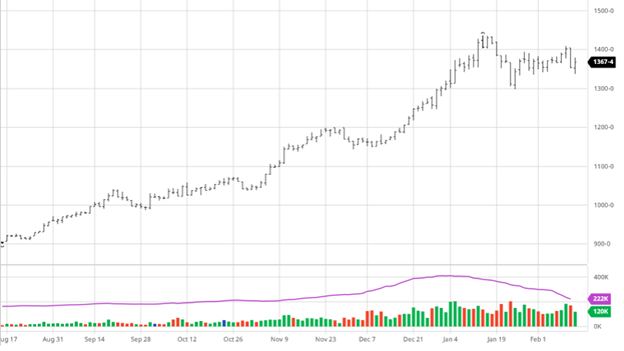
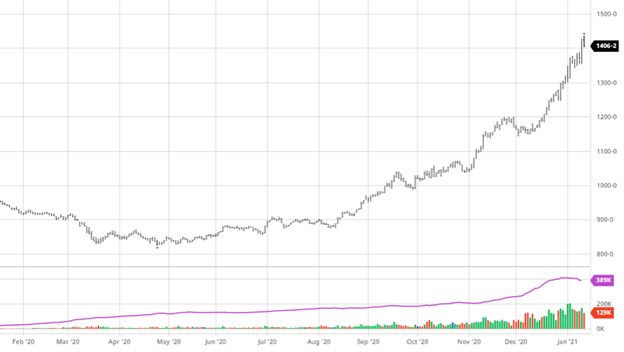
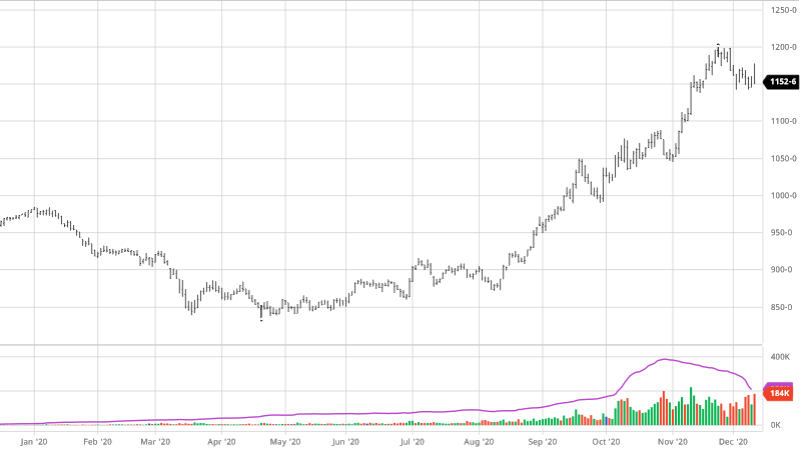
Soybeans were up slightly on the week but have been relatively flat (relative to other weeks) the last two weeks, as you can see in the chart below. The continued weather issues in South America and the Russia v Ukraine possible invasion have been the movers for beans just like corn and wheat. Bean exports this week were the best of the group, with a flash old crop sale being announced on Thursday. We have seen private estimates continue to roll in for production in South America and what to expect this year in the US. The USDA Ag Outlook Forum will start next Wednesday, and we should find out what they are expecting for the year ahead and how the US will affect balance sheets. The insurance price for beans is $14.22 ½.
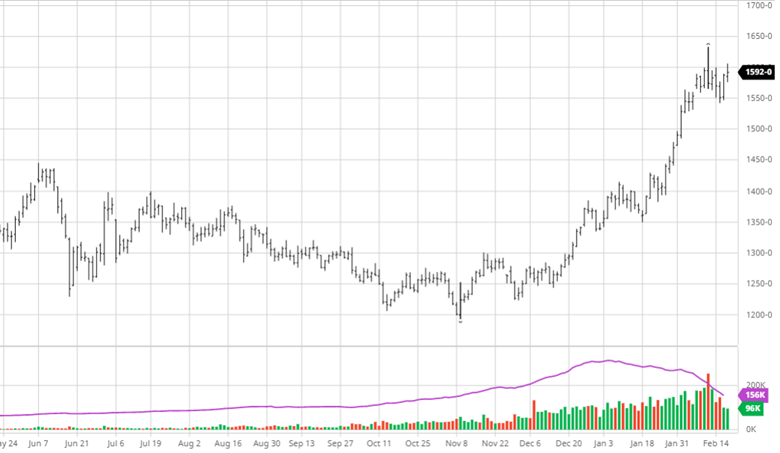

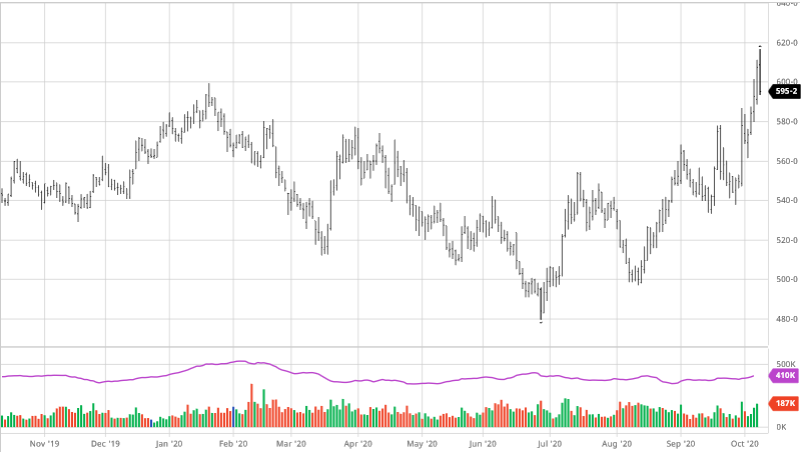
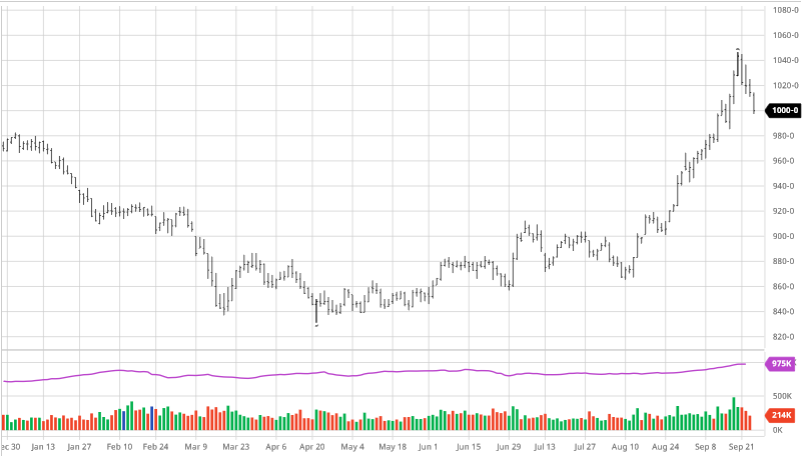
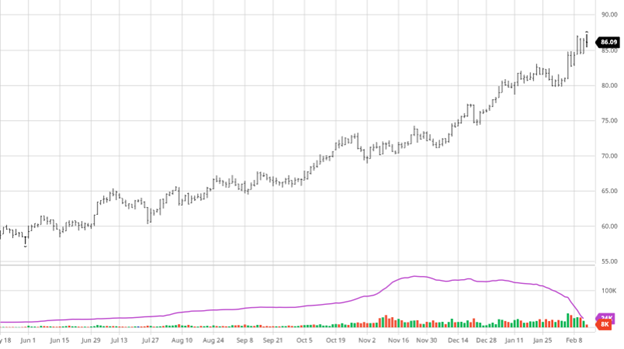
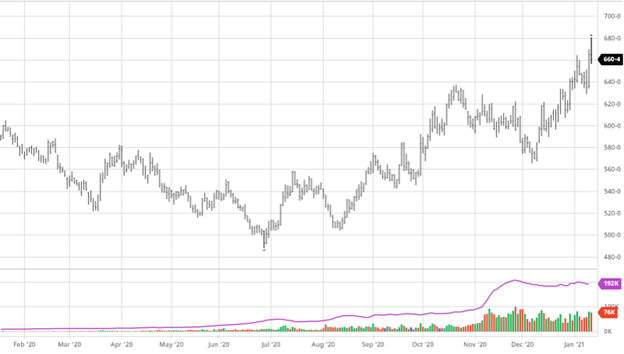
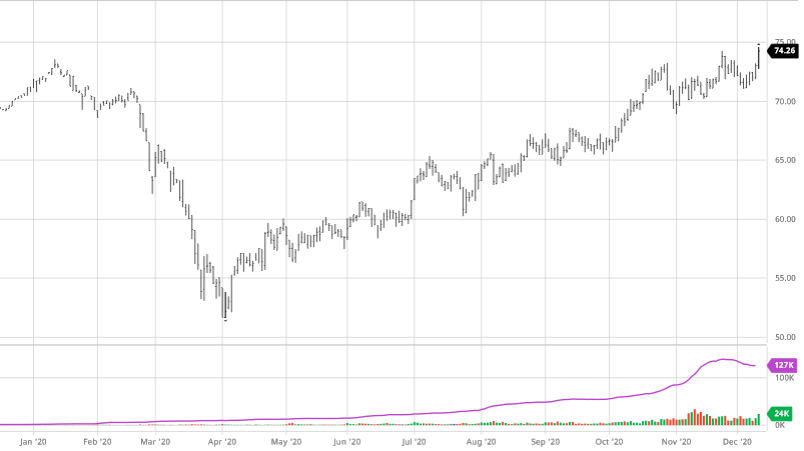
Wheat has been on a roller coaster the last two months with the ups and downs and uncertainties around Russia and Ukraine. A Russia invasion would be bullish for wheat as countries would shy away from trade with Russia, and Ukraine would stop exports as they try to keep Russia at bay. The Black Sea is a major world trade region. This conflict could lead to potential stoppages, shortages, or even a possible blockade in the region that would cripple a major trade corridor. Keep an eye on this developing story as it could have potential long-term consequences as the US has also threatened Russia with sanctions (they don’t seem to be fazed at all by Washington’s threats).
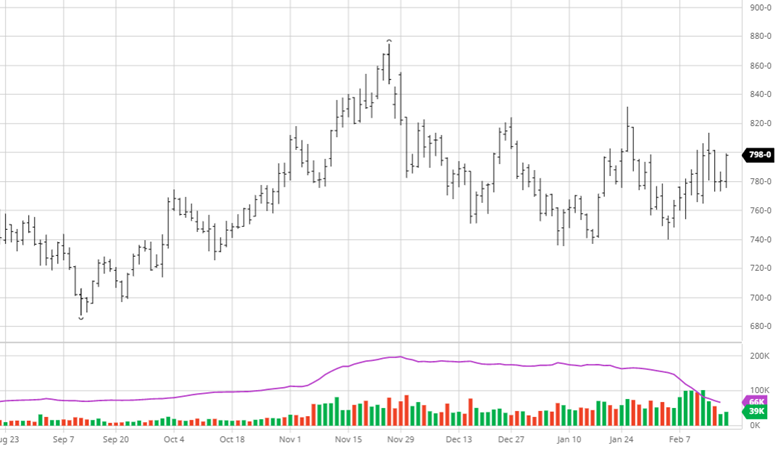

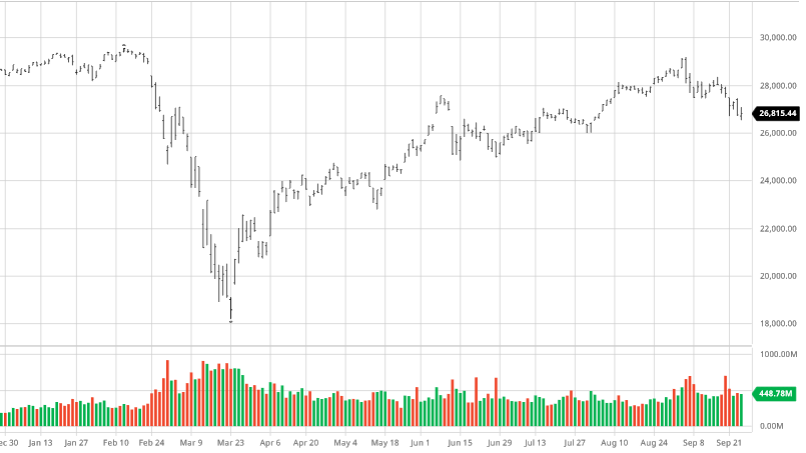
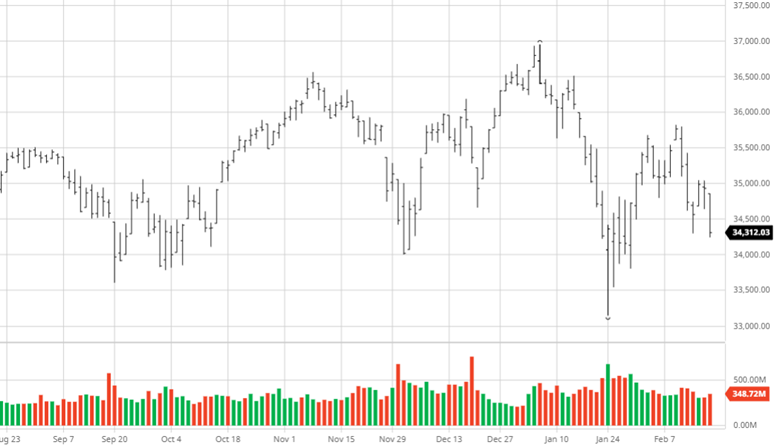
Dow Jones
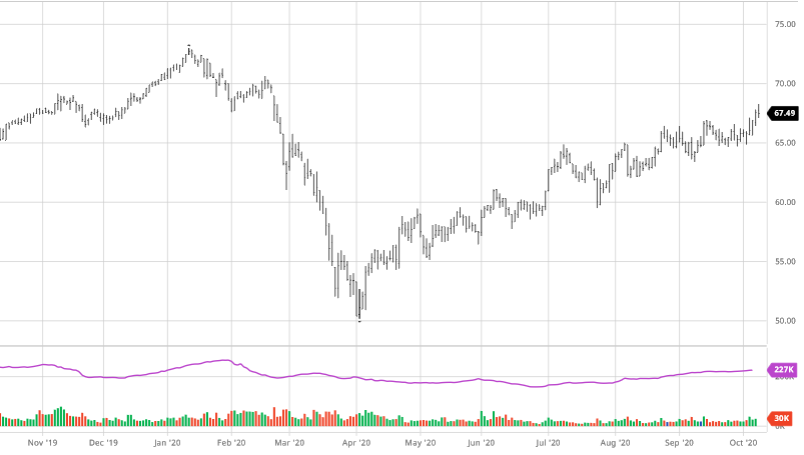
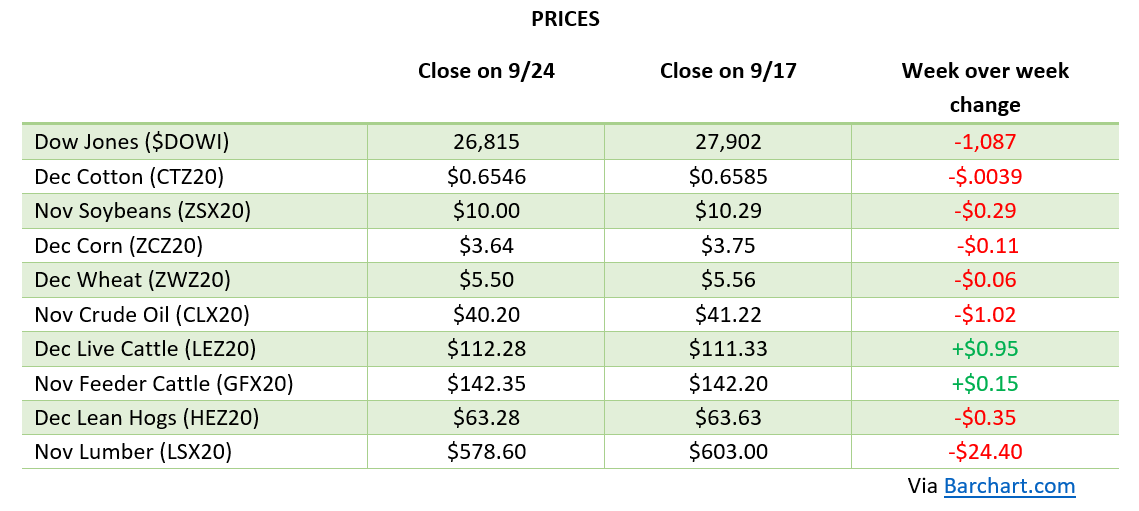
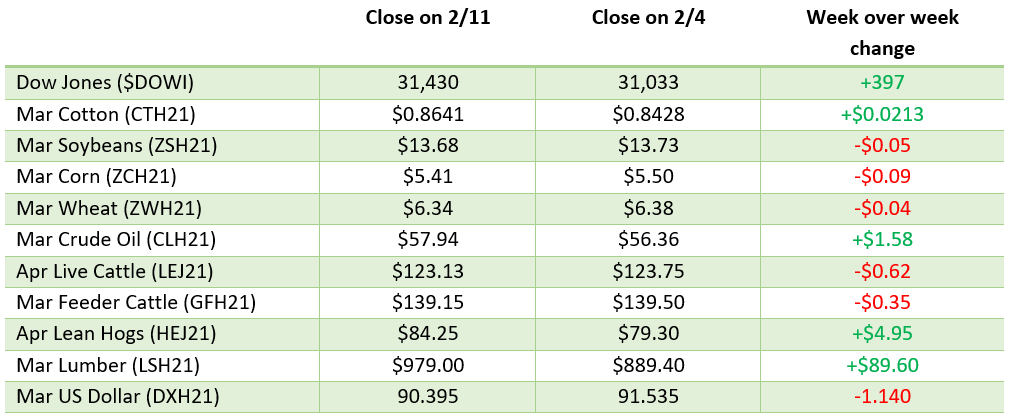
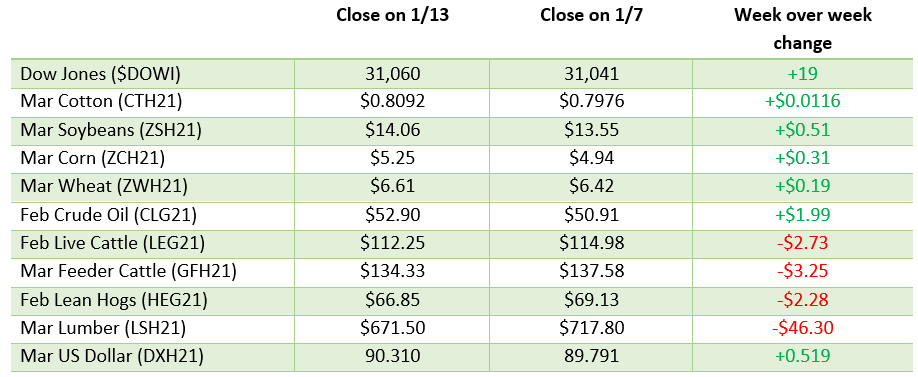
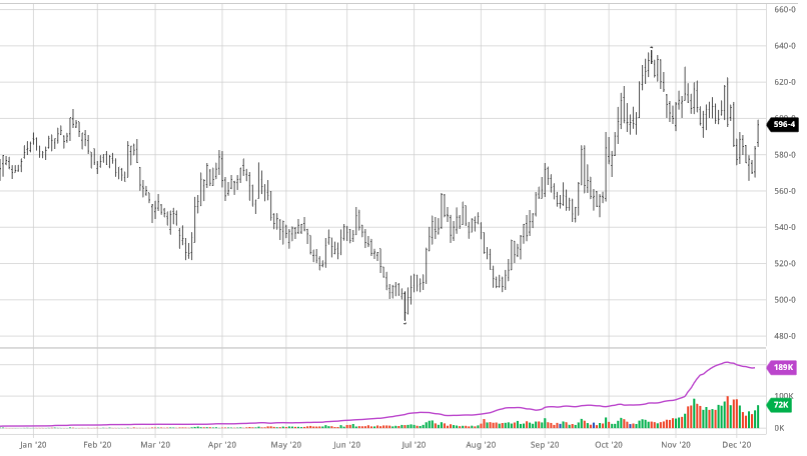
This week, the equity markets fell as confusion and concerns of post-Olympic wars between a few countries inch closer. Russia was reported to have changed their mind on invading Ukraine, only for that news to switch to them adding troops at the border. China invading Taiwan post-Olympics is also a possibility as that has seemed to be forgotten as the Russia news took over the market. Earnings season has been mixed with losers and winners in all sectors as inflation has begun to show up more in guidance for the year ahead.
Podcast
Tune in as biotech guru Dr. Channa S. Prakash discusses everything from Alabama football, genetics as one of the most extensive agricultural advancements, the most significant risk factors to feeding the world over the next 30-50 years, plus everything in between.
Why producing crop plants with a much gentler footprint on the natural resources will help feed the growing population. How 75% of the world’s patents in agriculture gene editing are coming from China. Understanding that trying to impose restrictions on our ability to grow food can be a considerable risk to agriculture. Listen to hear about these topics and more!
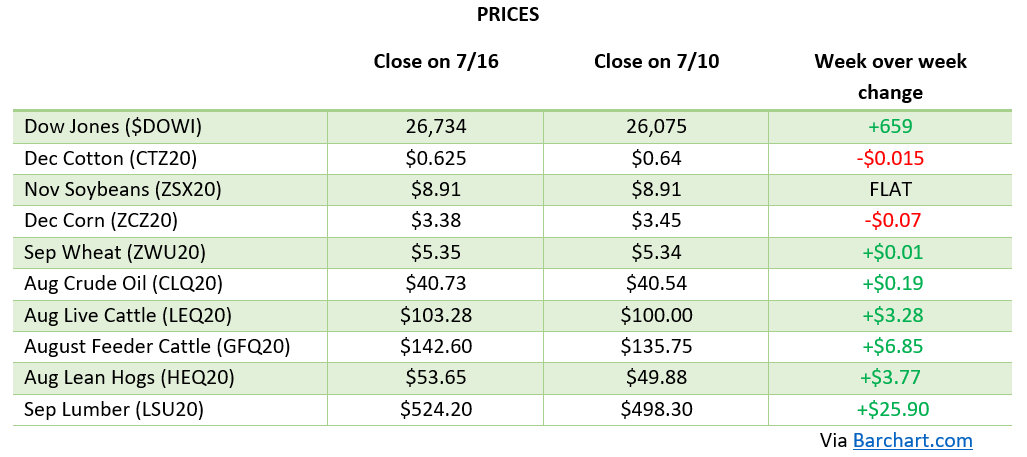
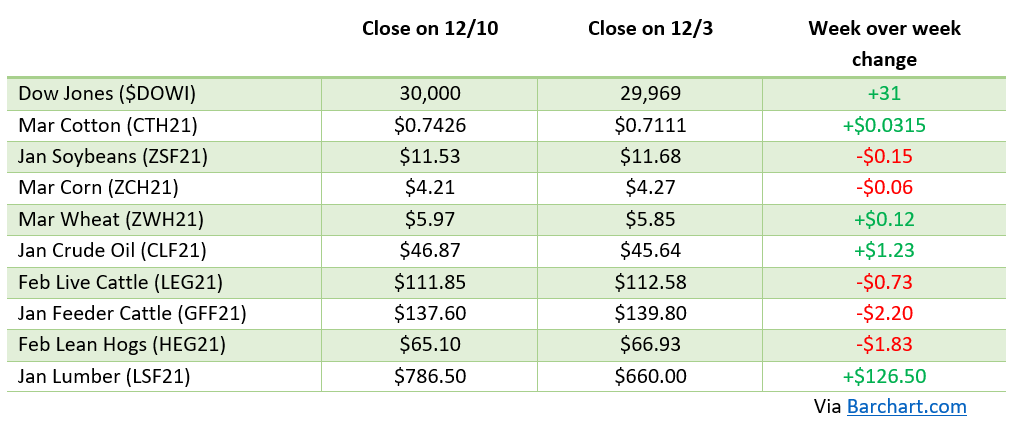
Via Barchart.com
Contact an Ag Specialist Today
Whether you’re a producer, end-user, commercial operator, RCM AG Services helps protect revenues and control costs through its suite of hedging tools and network of buyers/sellers — Contact Ag Specialist Brady Lawrence today at 312-858-4049 or blawrence@rcmam.com.






 ,
,